



Last week played out as expected with the post FOMC rally but we are now at a point where several indicators and reads are conflicting, creating an environment where having too much conviction on what comes next, a potentially dangerous strategy.
Last Week in Review
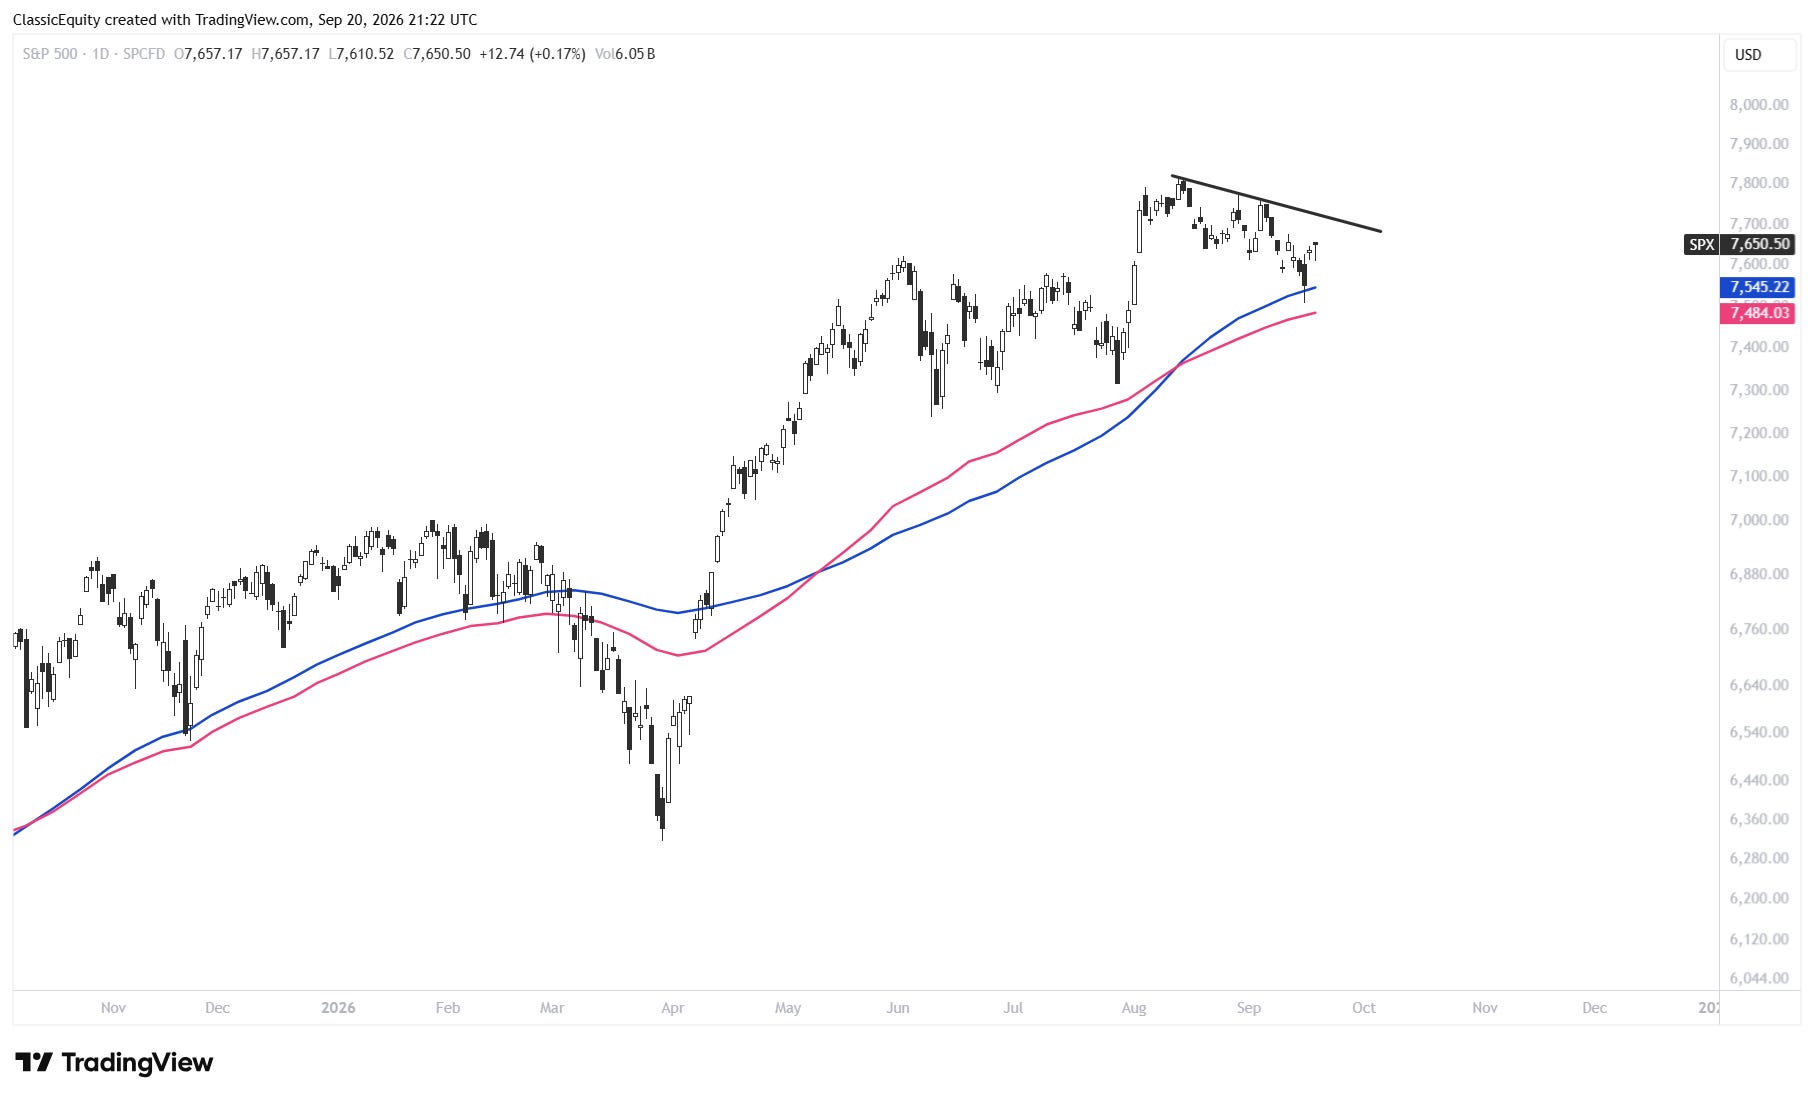
FOMC brought enough weakness for the S&P to tag its 20W moving average and bounce. A tip for those newer to technicals, the 20W and 21W moving averages are often great levels during bull markets and often major red flags when broken.
You can see below where the 20W (Blue) was briefly tagged and then got the bounce. Looking back you can see where these levels have bee important and often strong support.
Despite the volatile week we were able to take advantage, catching this bounce with upside trades in a few of our favorite setups.
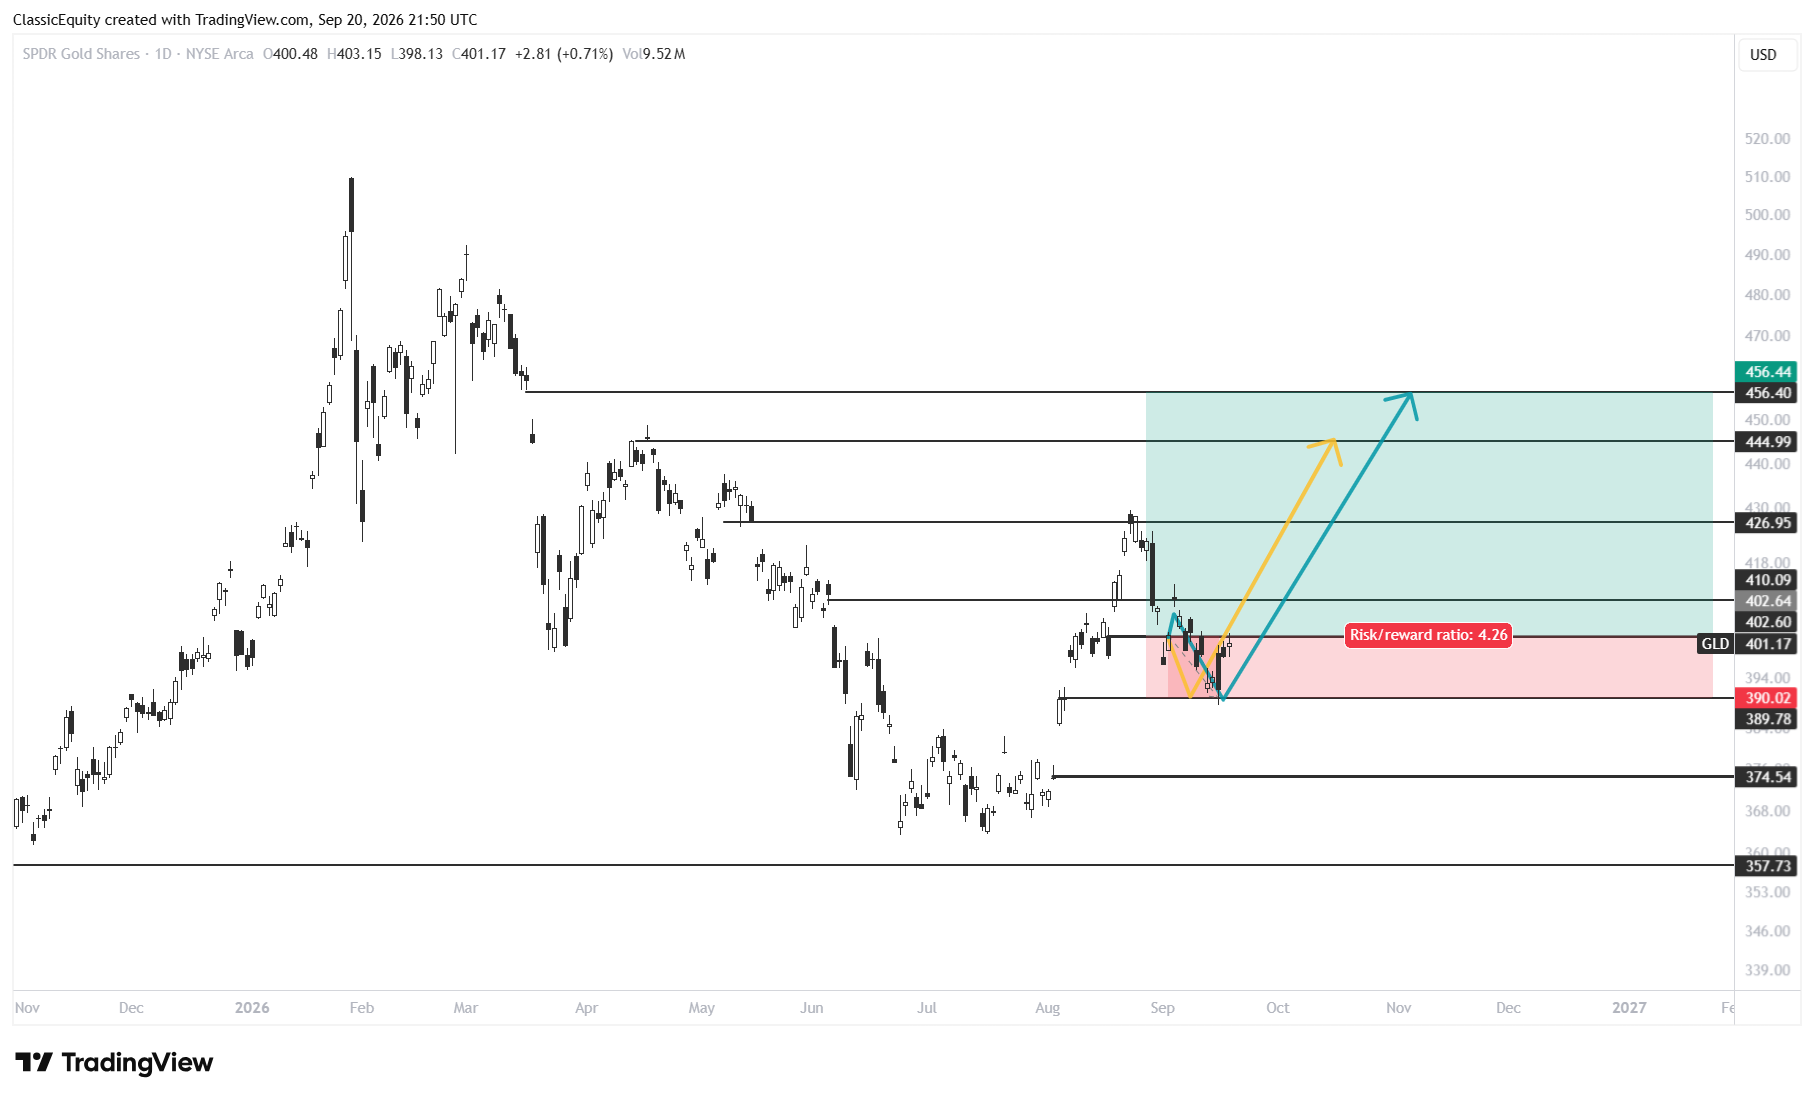
GLD hit our level, overnight calls ran from 1.80 to over 3.50 by open
BABA calls ran from 1.60 to over 3.10 a contract

Despite the bounce, there is a reason we are locking profit early and often. We are now entering some of the weakest seasonality of the year, especially during Mid Terms. Combine that with the macro risk of energy right now and rates trying to stabilize, there is no reason to get greedy here.

Evidence-led financial research combining macro, technicals, and flow to create an edge in every market environment
Join our premium subscribers with this special offer
Market Setup
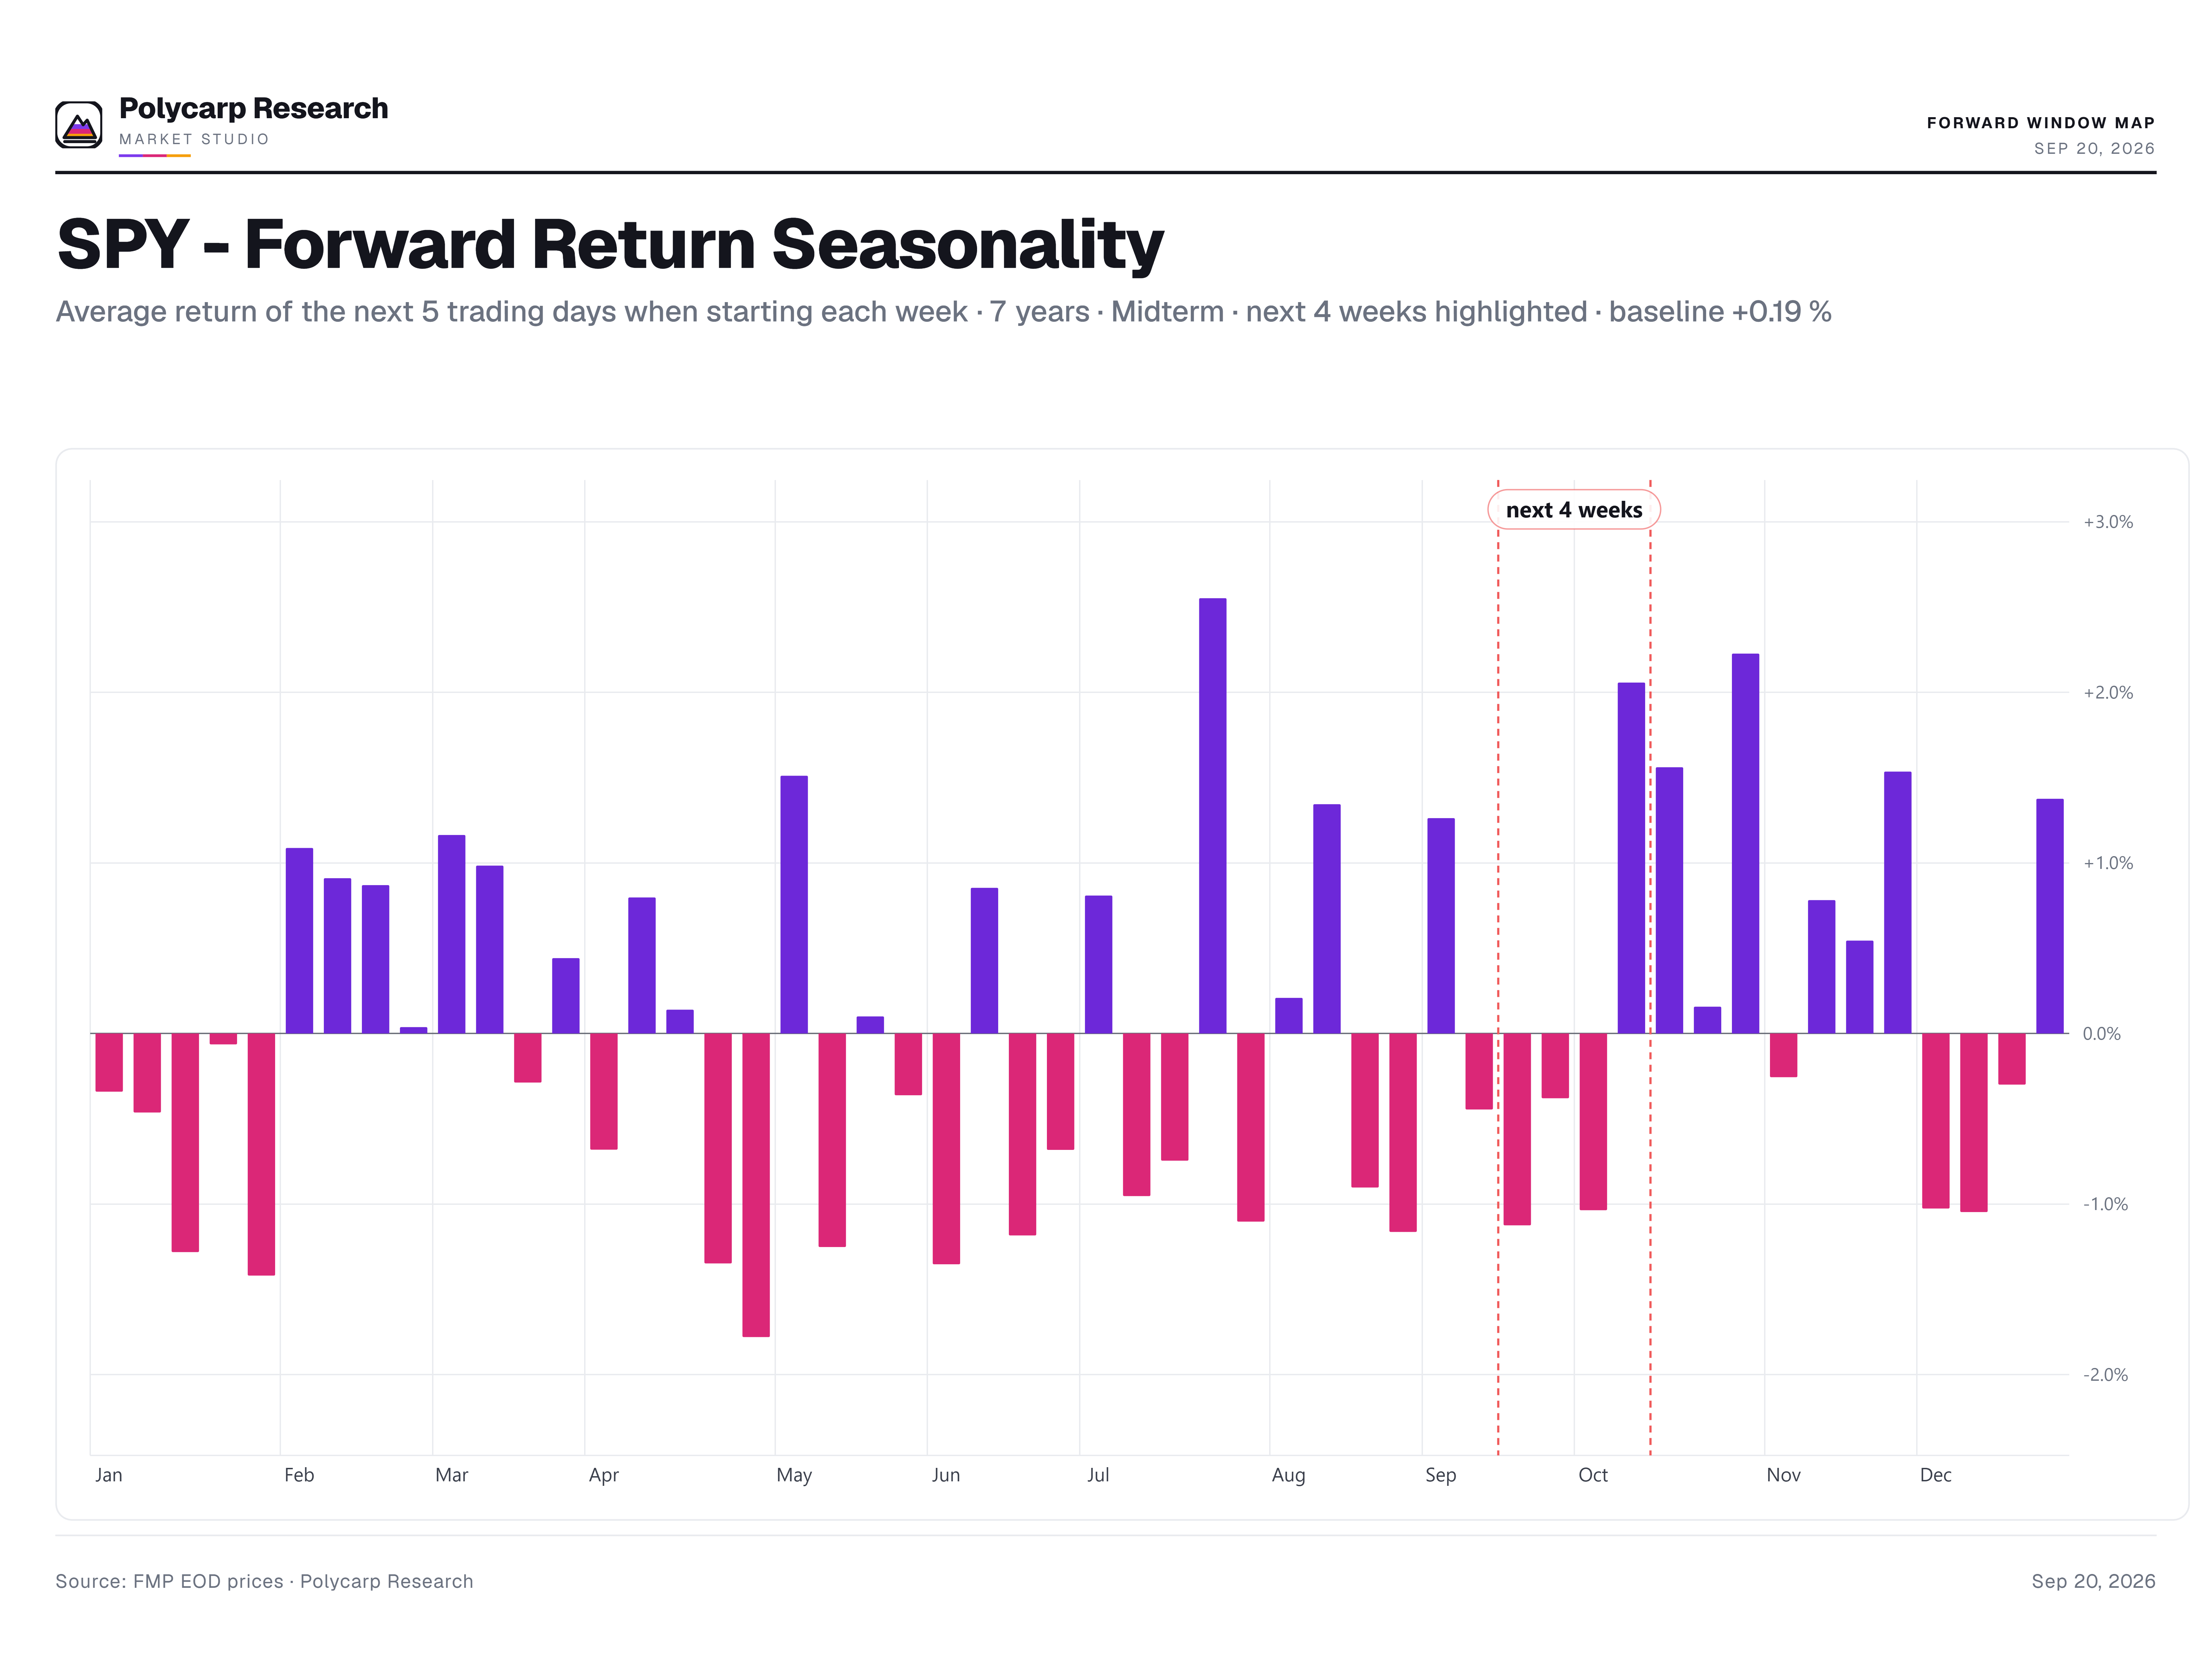
The chart above shows where we are from a seasonal perspective but that is only one data point of many in any environment. What makes this current market setup more challenging is that despite a risk-off macro backdrop and entering the weakest seasonality of the year, we also have some bullish reads triggering that can’t be ignored.
The Bullish Argument
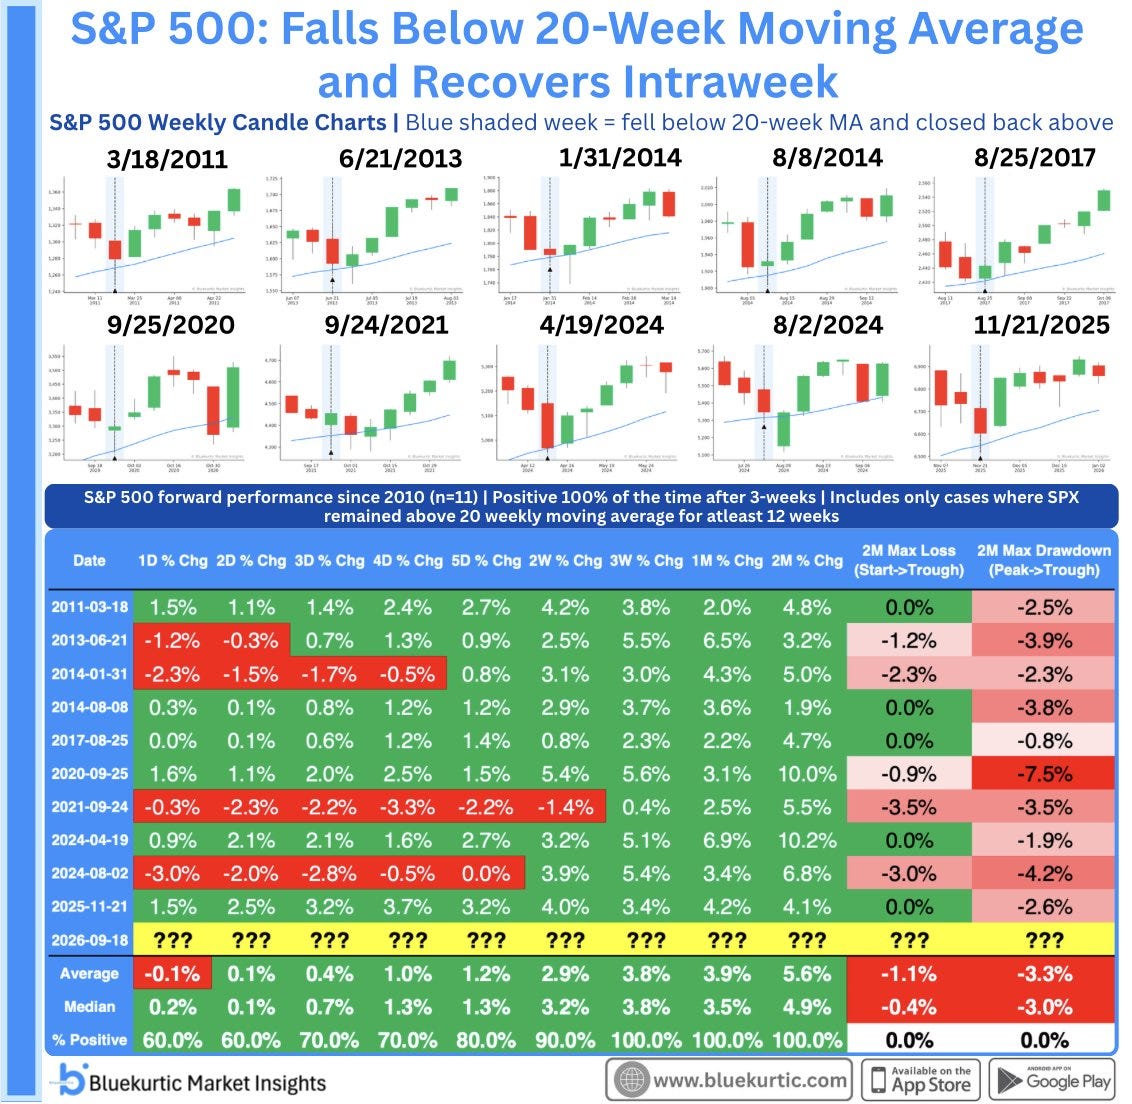
The 20W Moving Average. Bluekurtic shows below where the S&P 500 has a 100% positive hit rate since 2010 when the 20W is broken and recovered intraweek, like it was this past week.
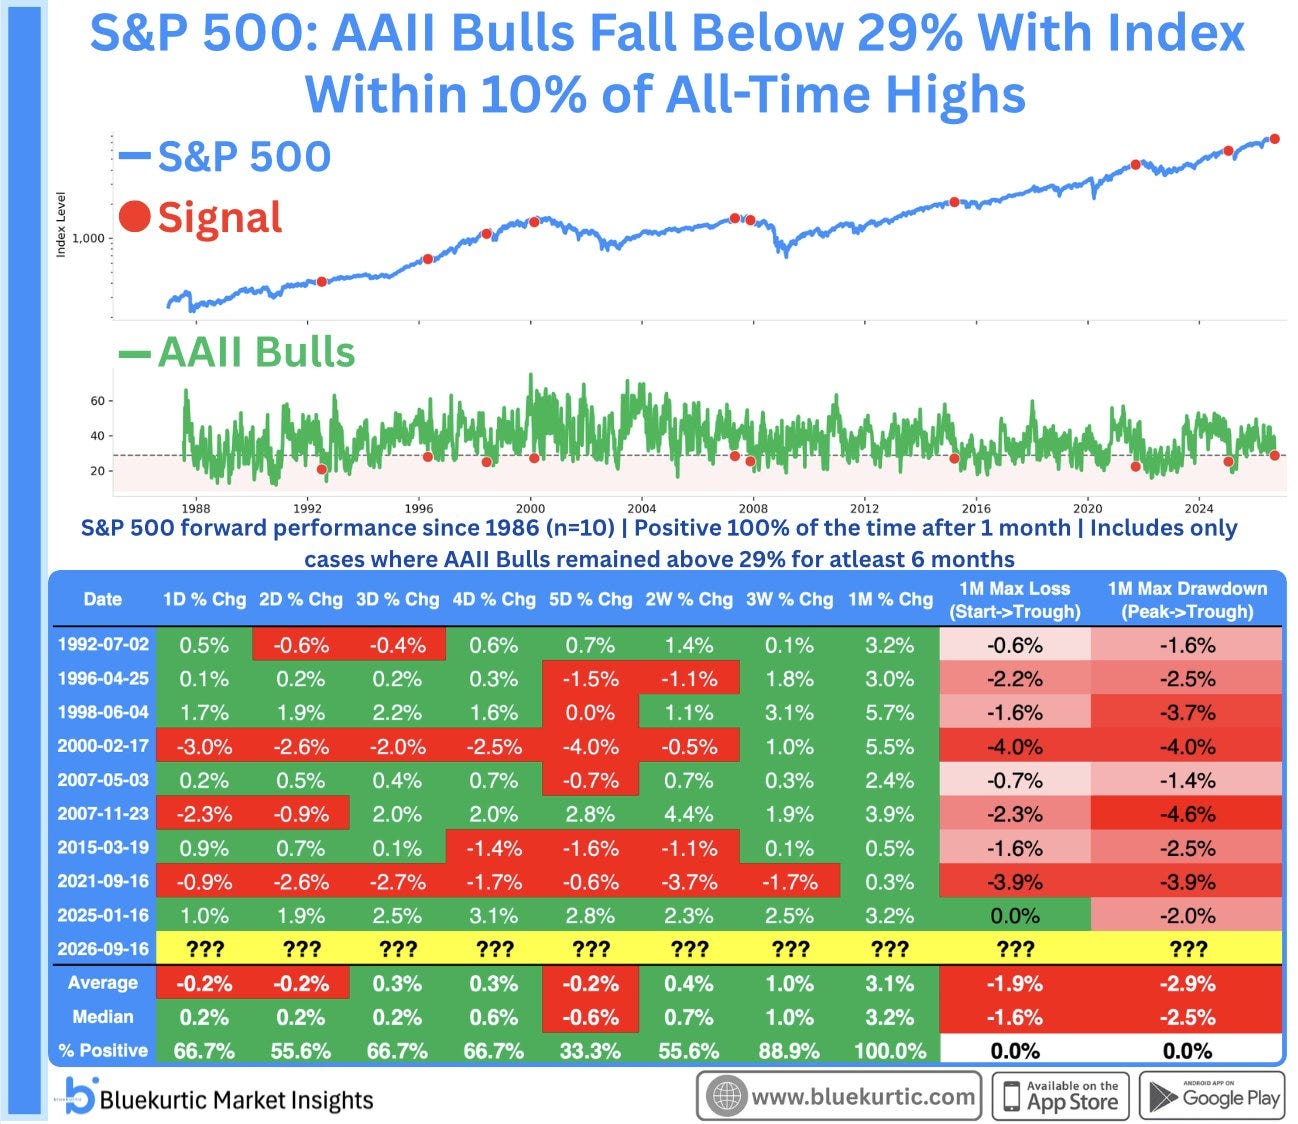
2. The AAII survey shows Bulls falling below 29%. When that happens near highs, it has lead to a positive 1 month return every time.
If oil tops, how is that not bullish for the market here?
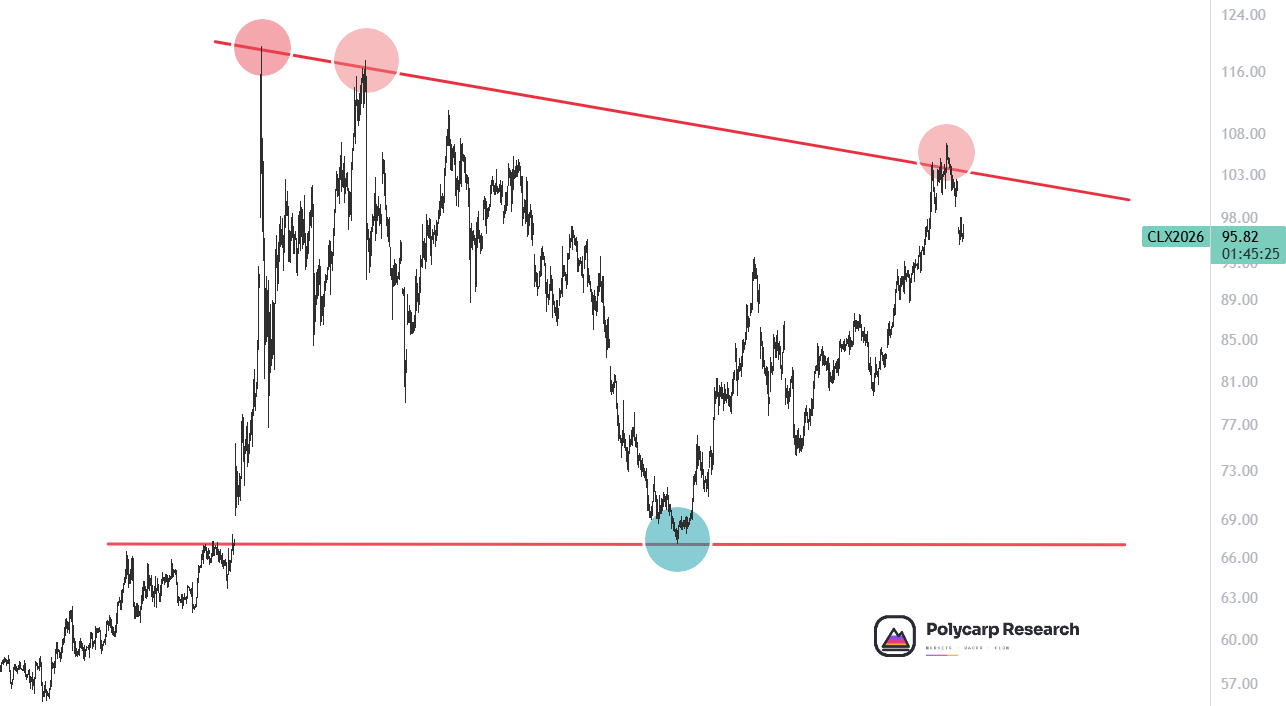
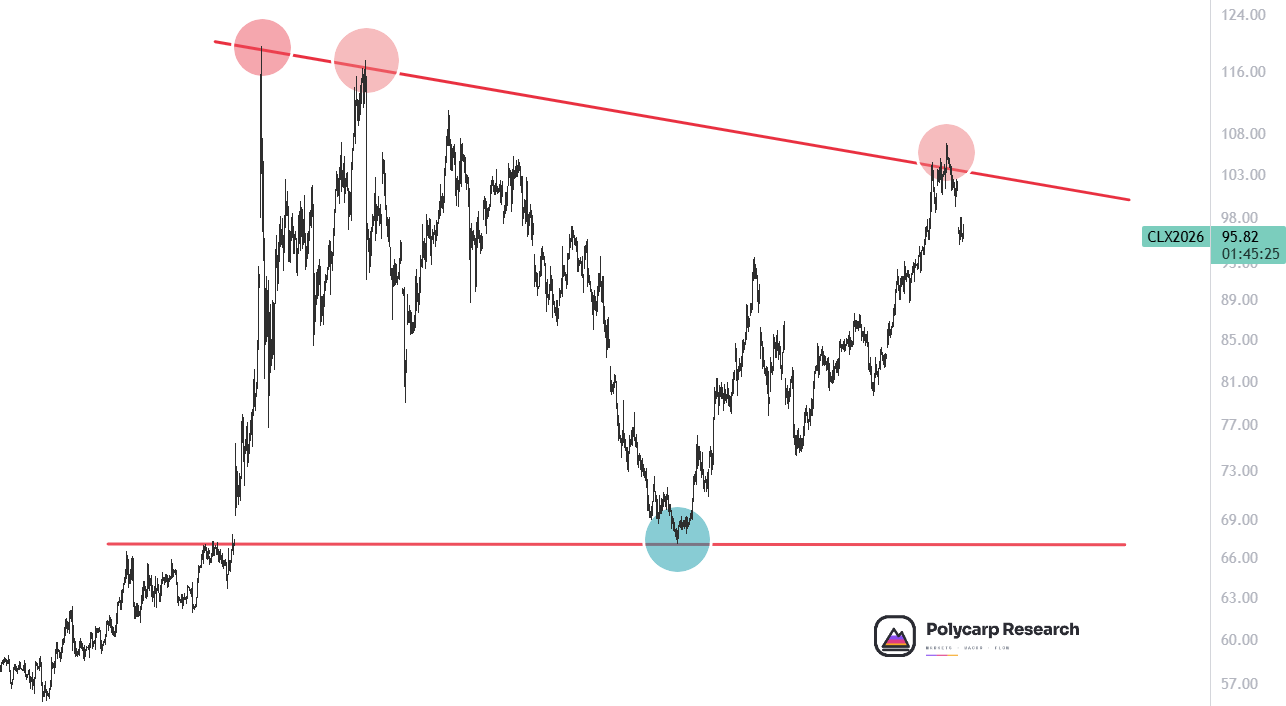
Bearish Argument
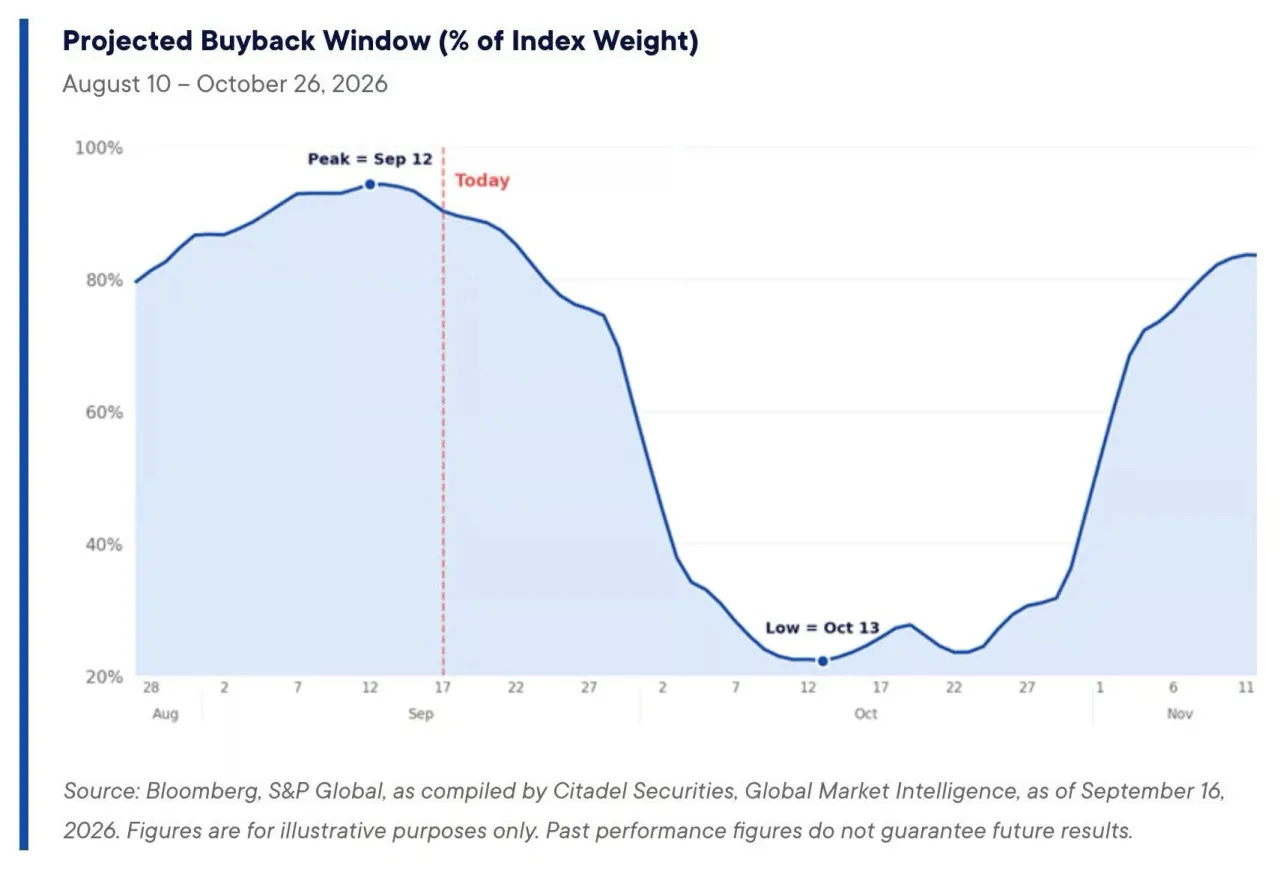
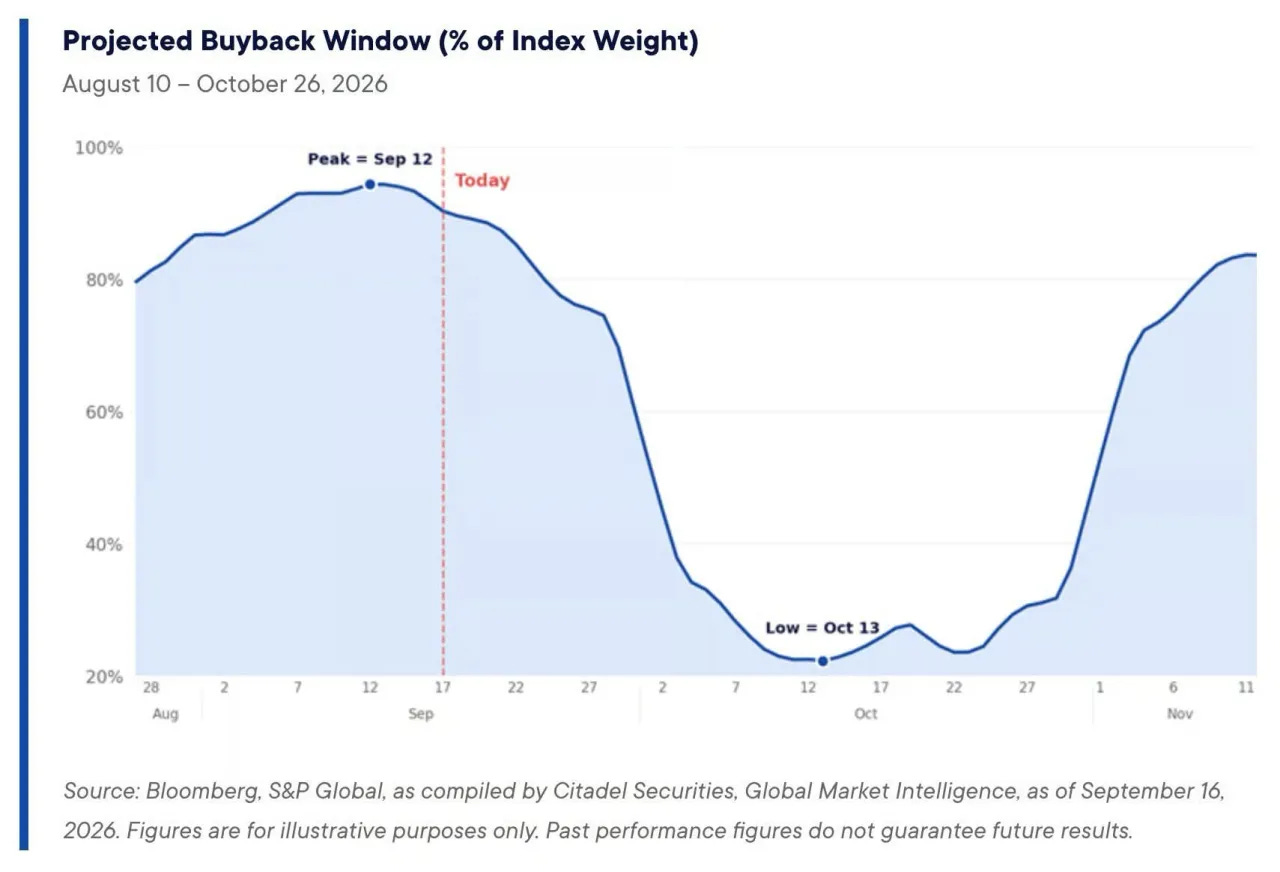
Buybacks have peaked until middle of October
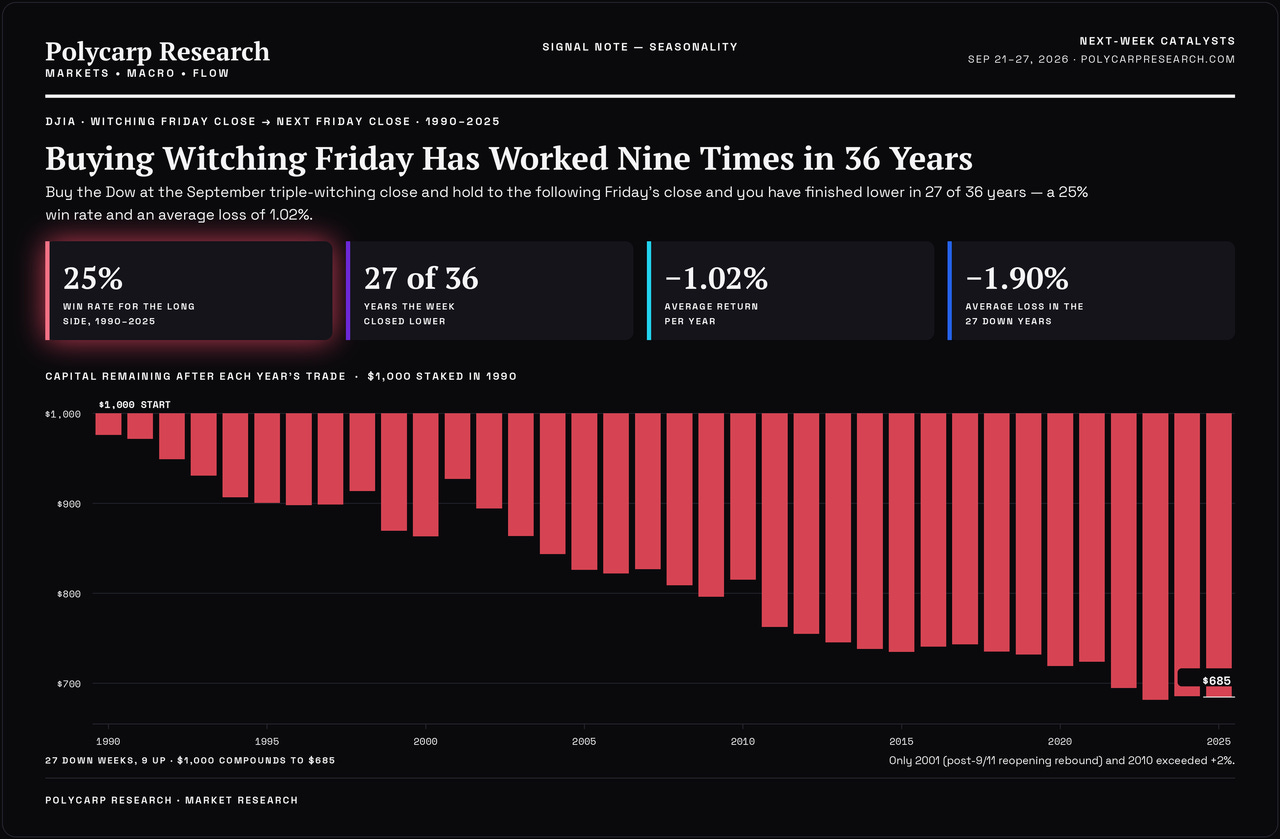
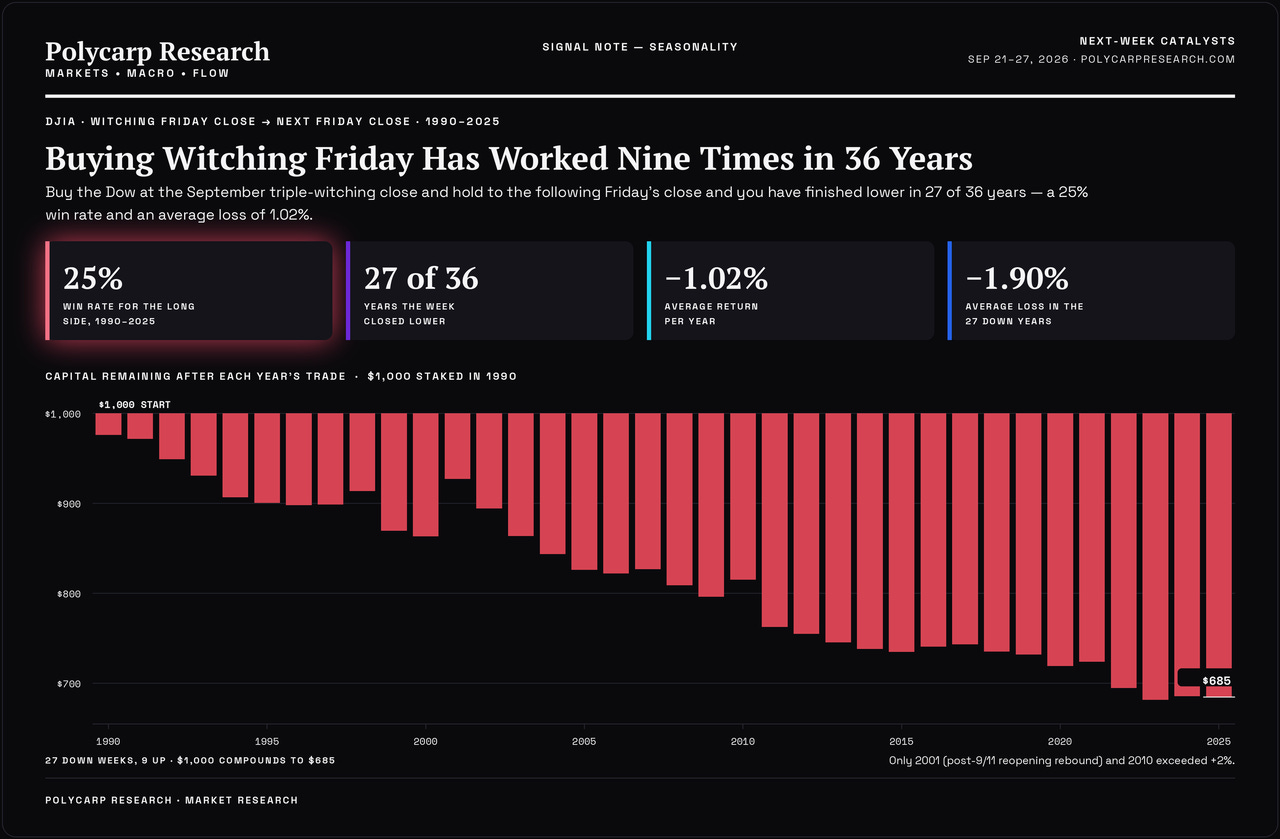
Data shows the week after triple witching has only been positive 9 times over the past 36 years!
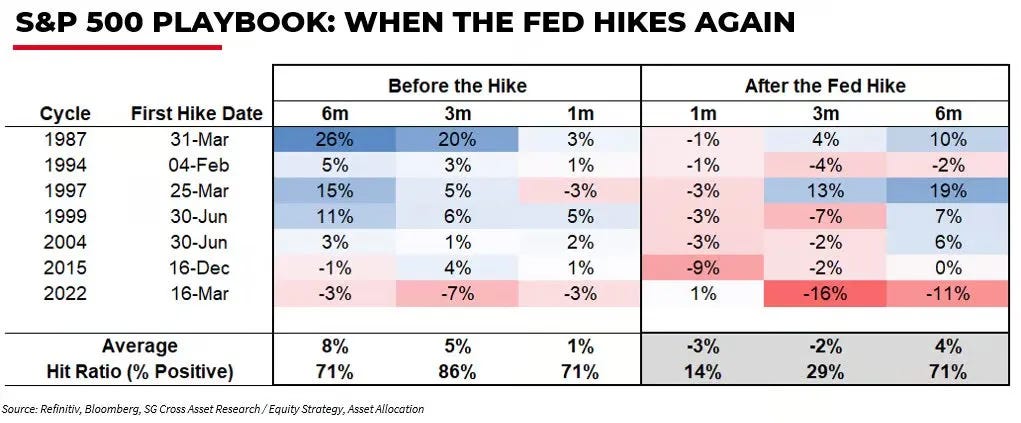
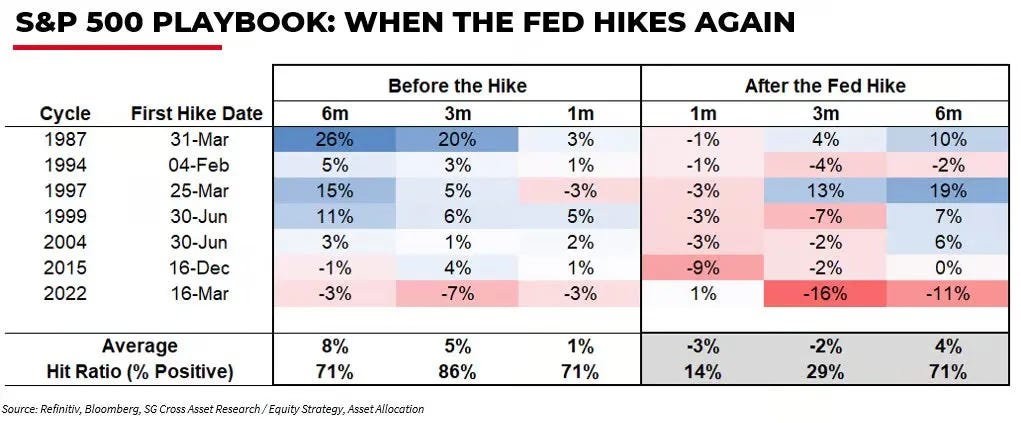
Post hike data shows negative returns often follow the 1st rate hike
Based off what I am seeing in the market, I am updating my downside targets where the black path I see as the likely outcome if we see more weakness, the blue is positive, and red if things escalate.
