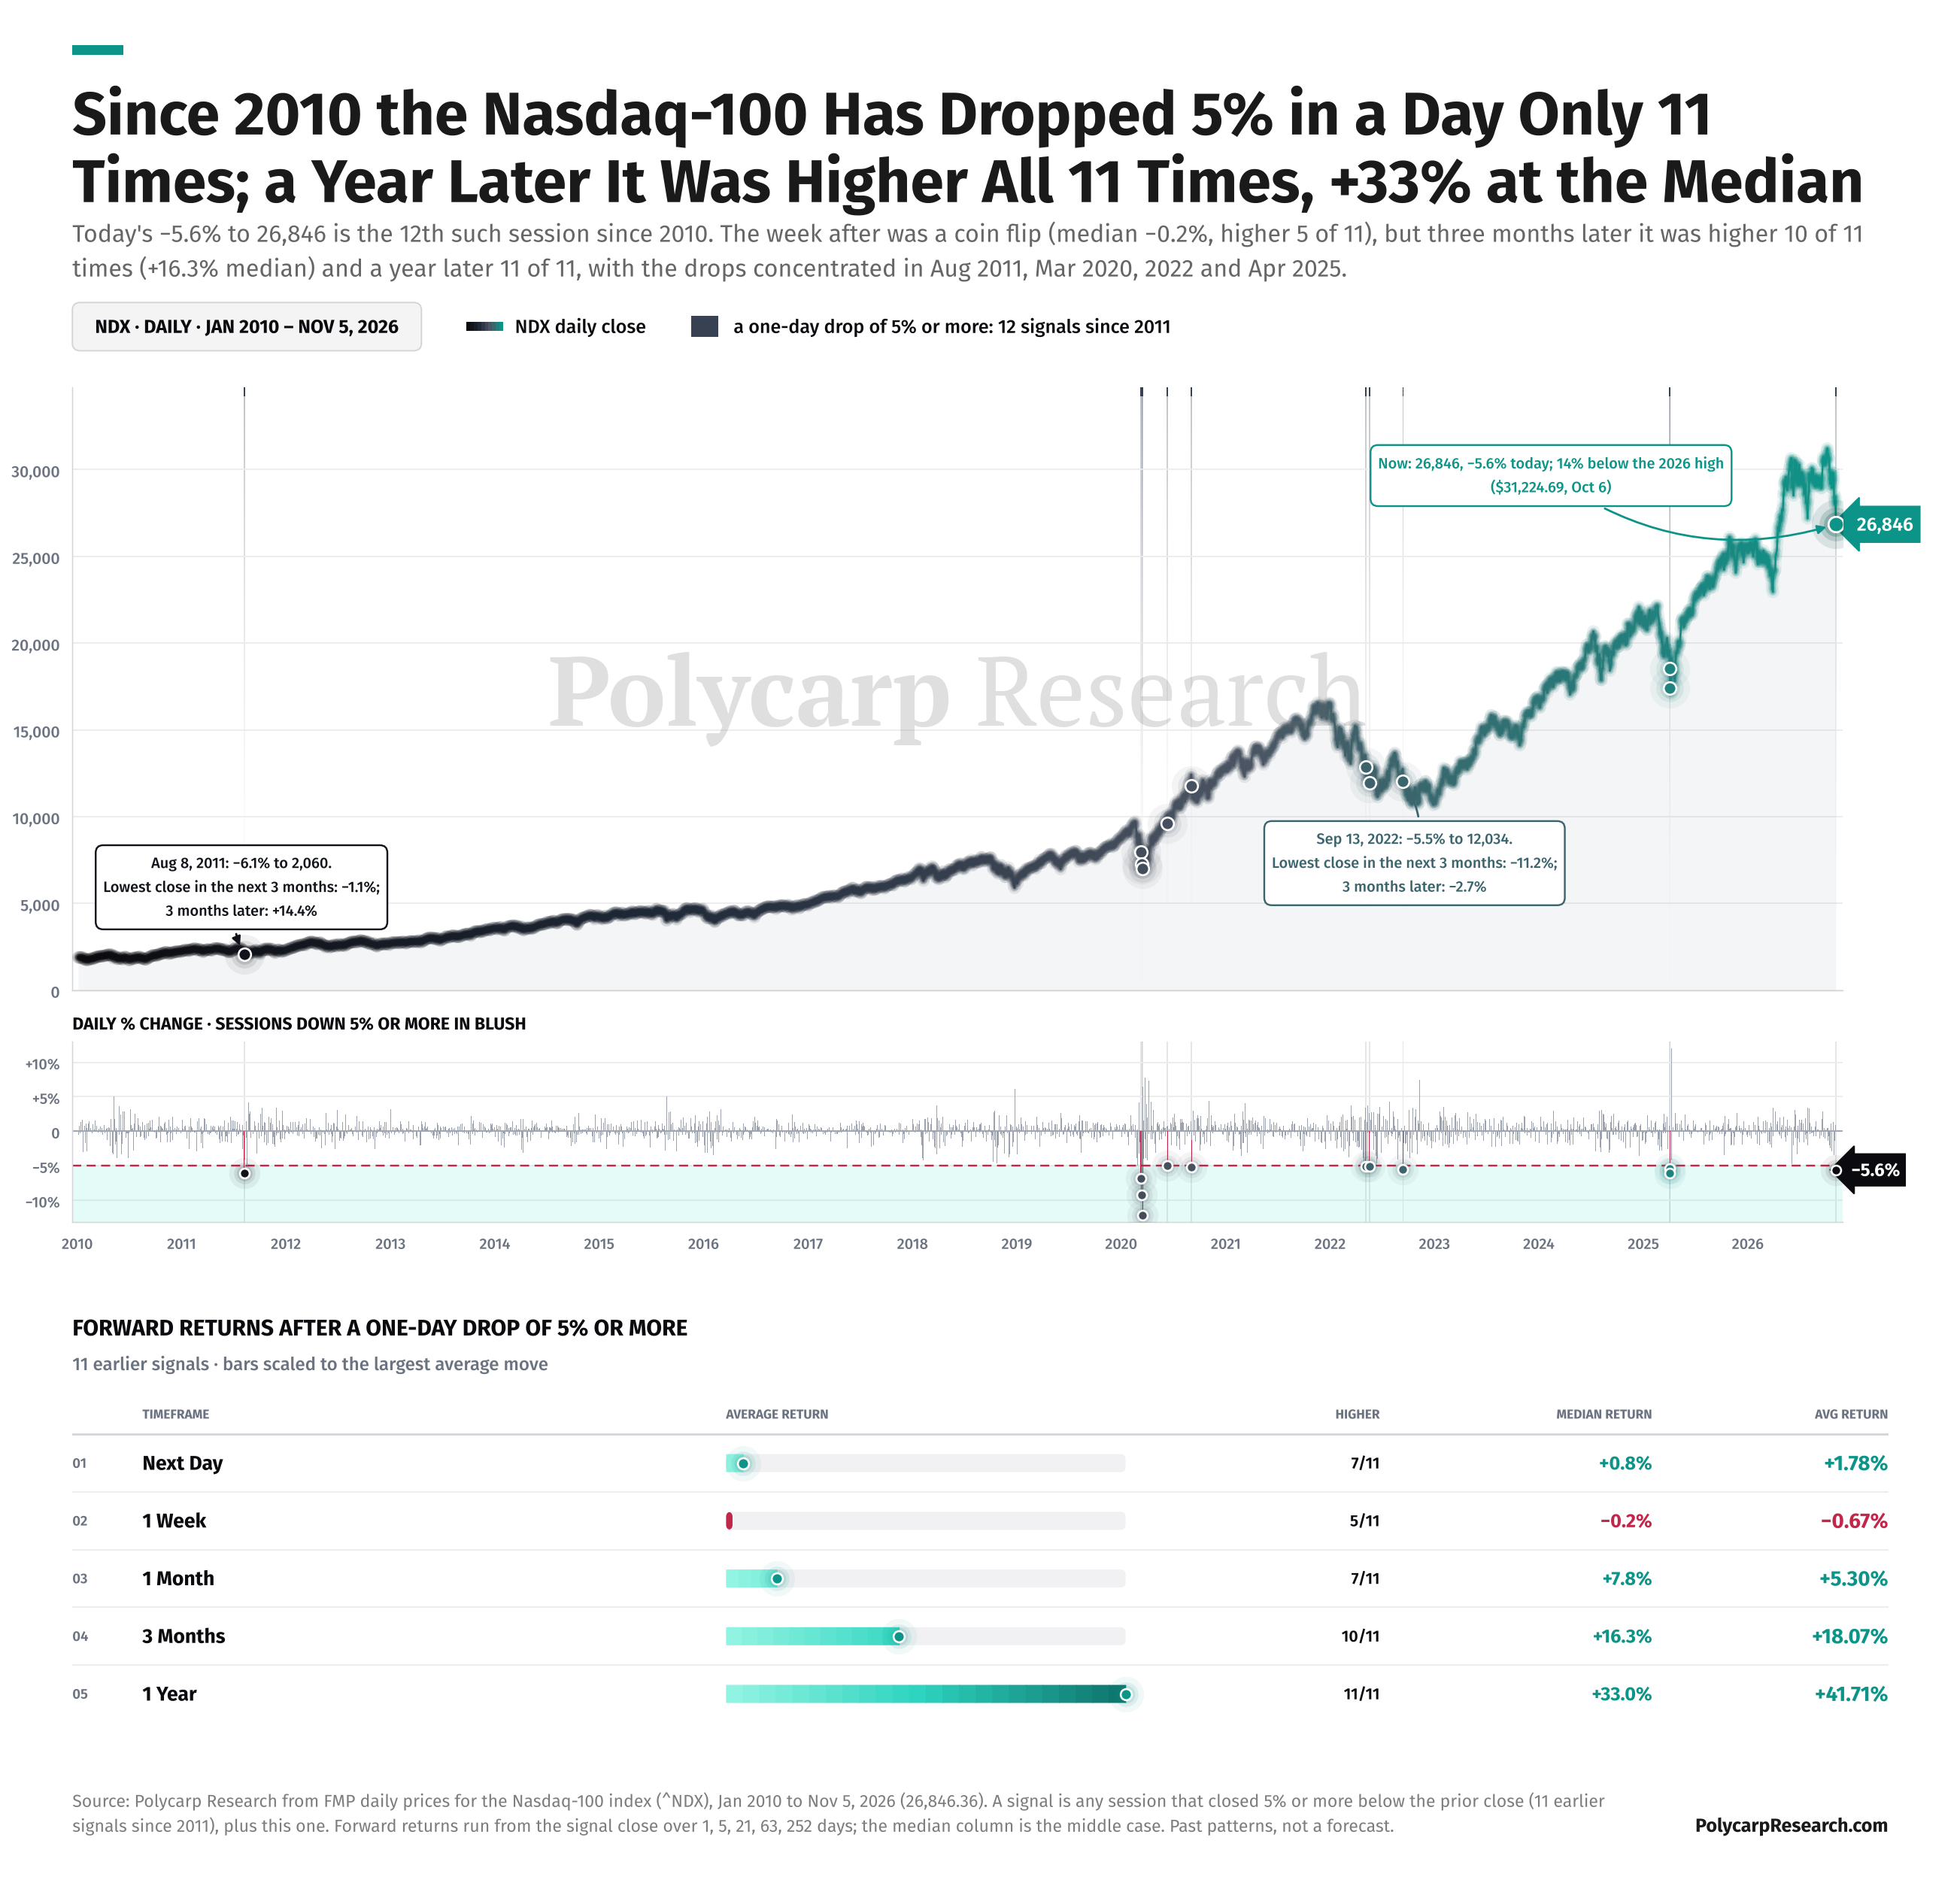
Last week we saw a rare event across the marked when the Nasdaq fell over 5% and the S&P not far behind it. Since 2010 these type of moves haven’t been the end of the world, as the Nasdaq was higher a year later every single time.
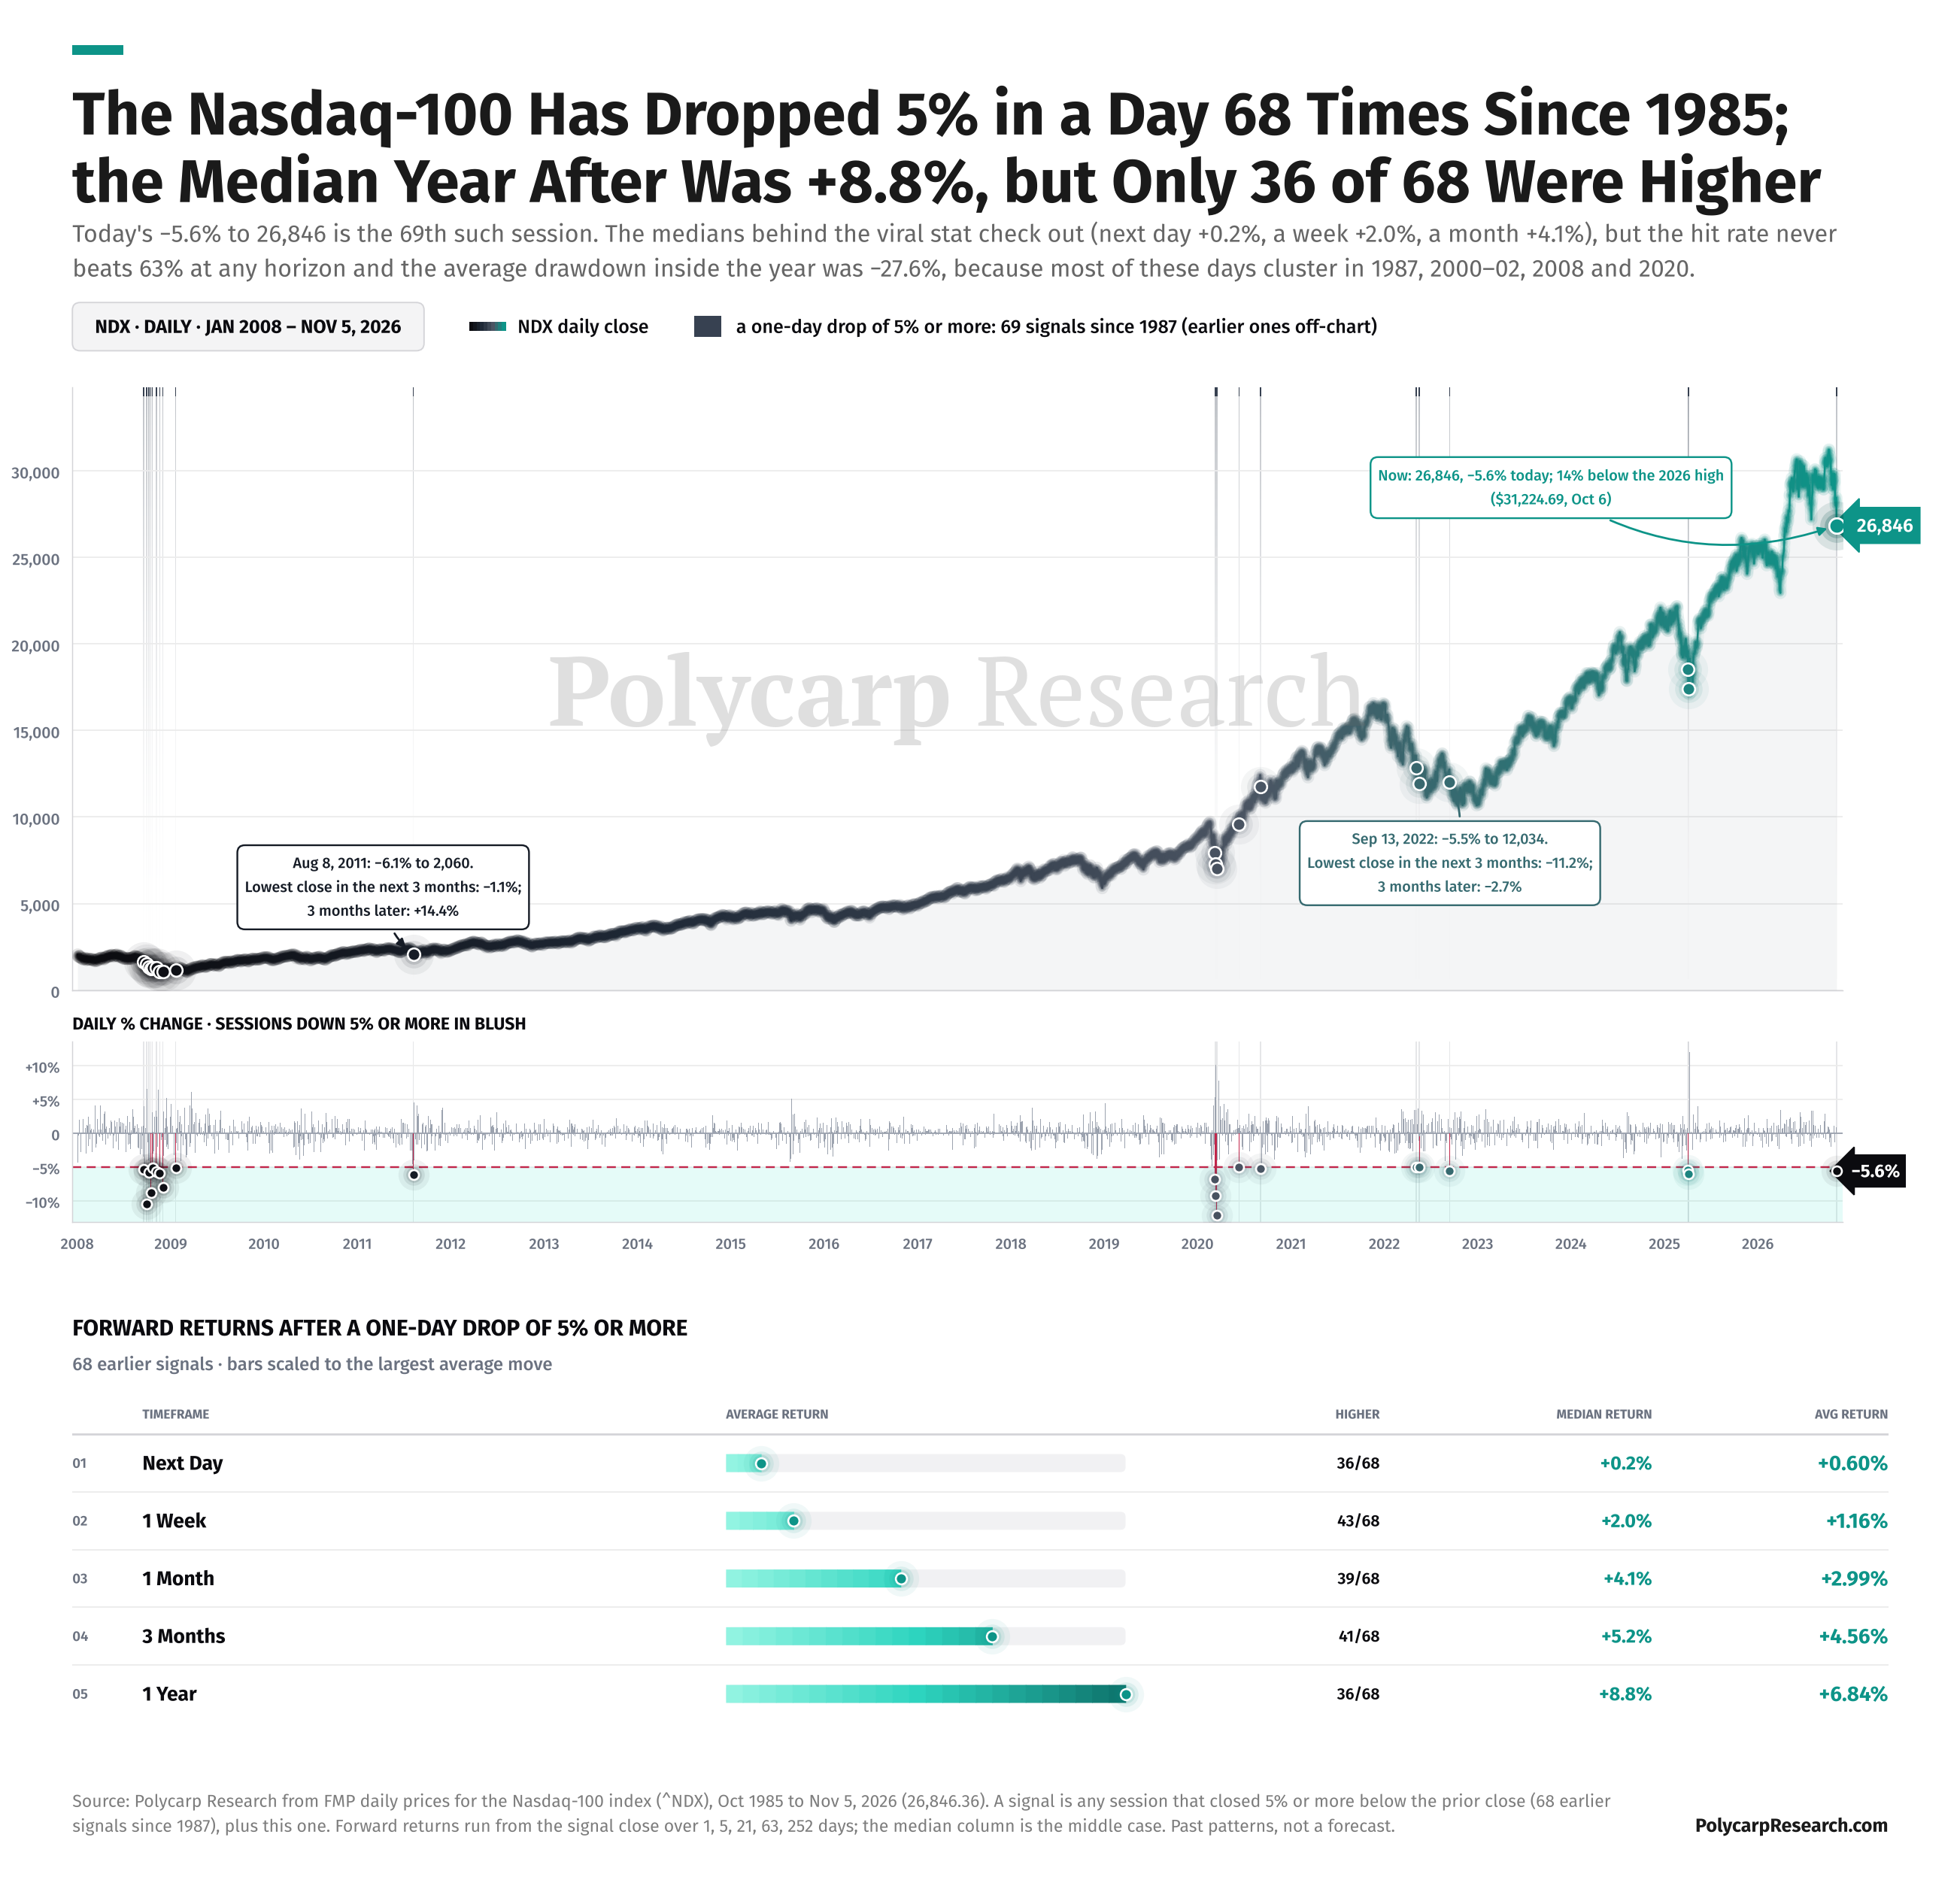
Looking further back, it can get a little more sketchy as only 36 of the 68 occurrences were higher a year later.
Shouldn’t be a surprise to see a bounce here but the key will be navigating what comes after this bounce. Have we bottomed for the year or is more volatility ahead? Let’s dive in.
The Market Leader Has Been Shot
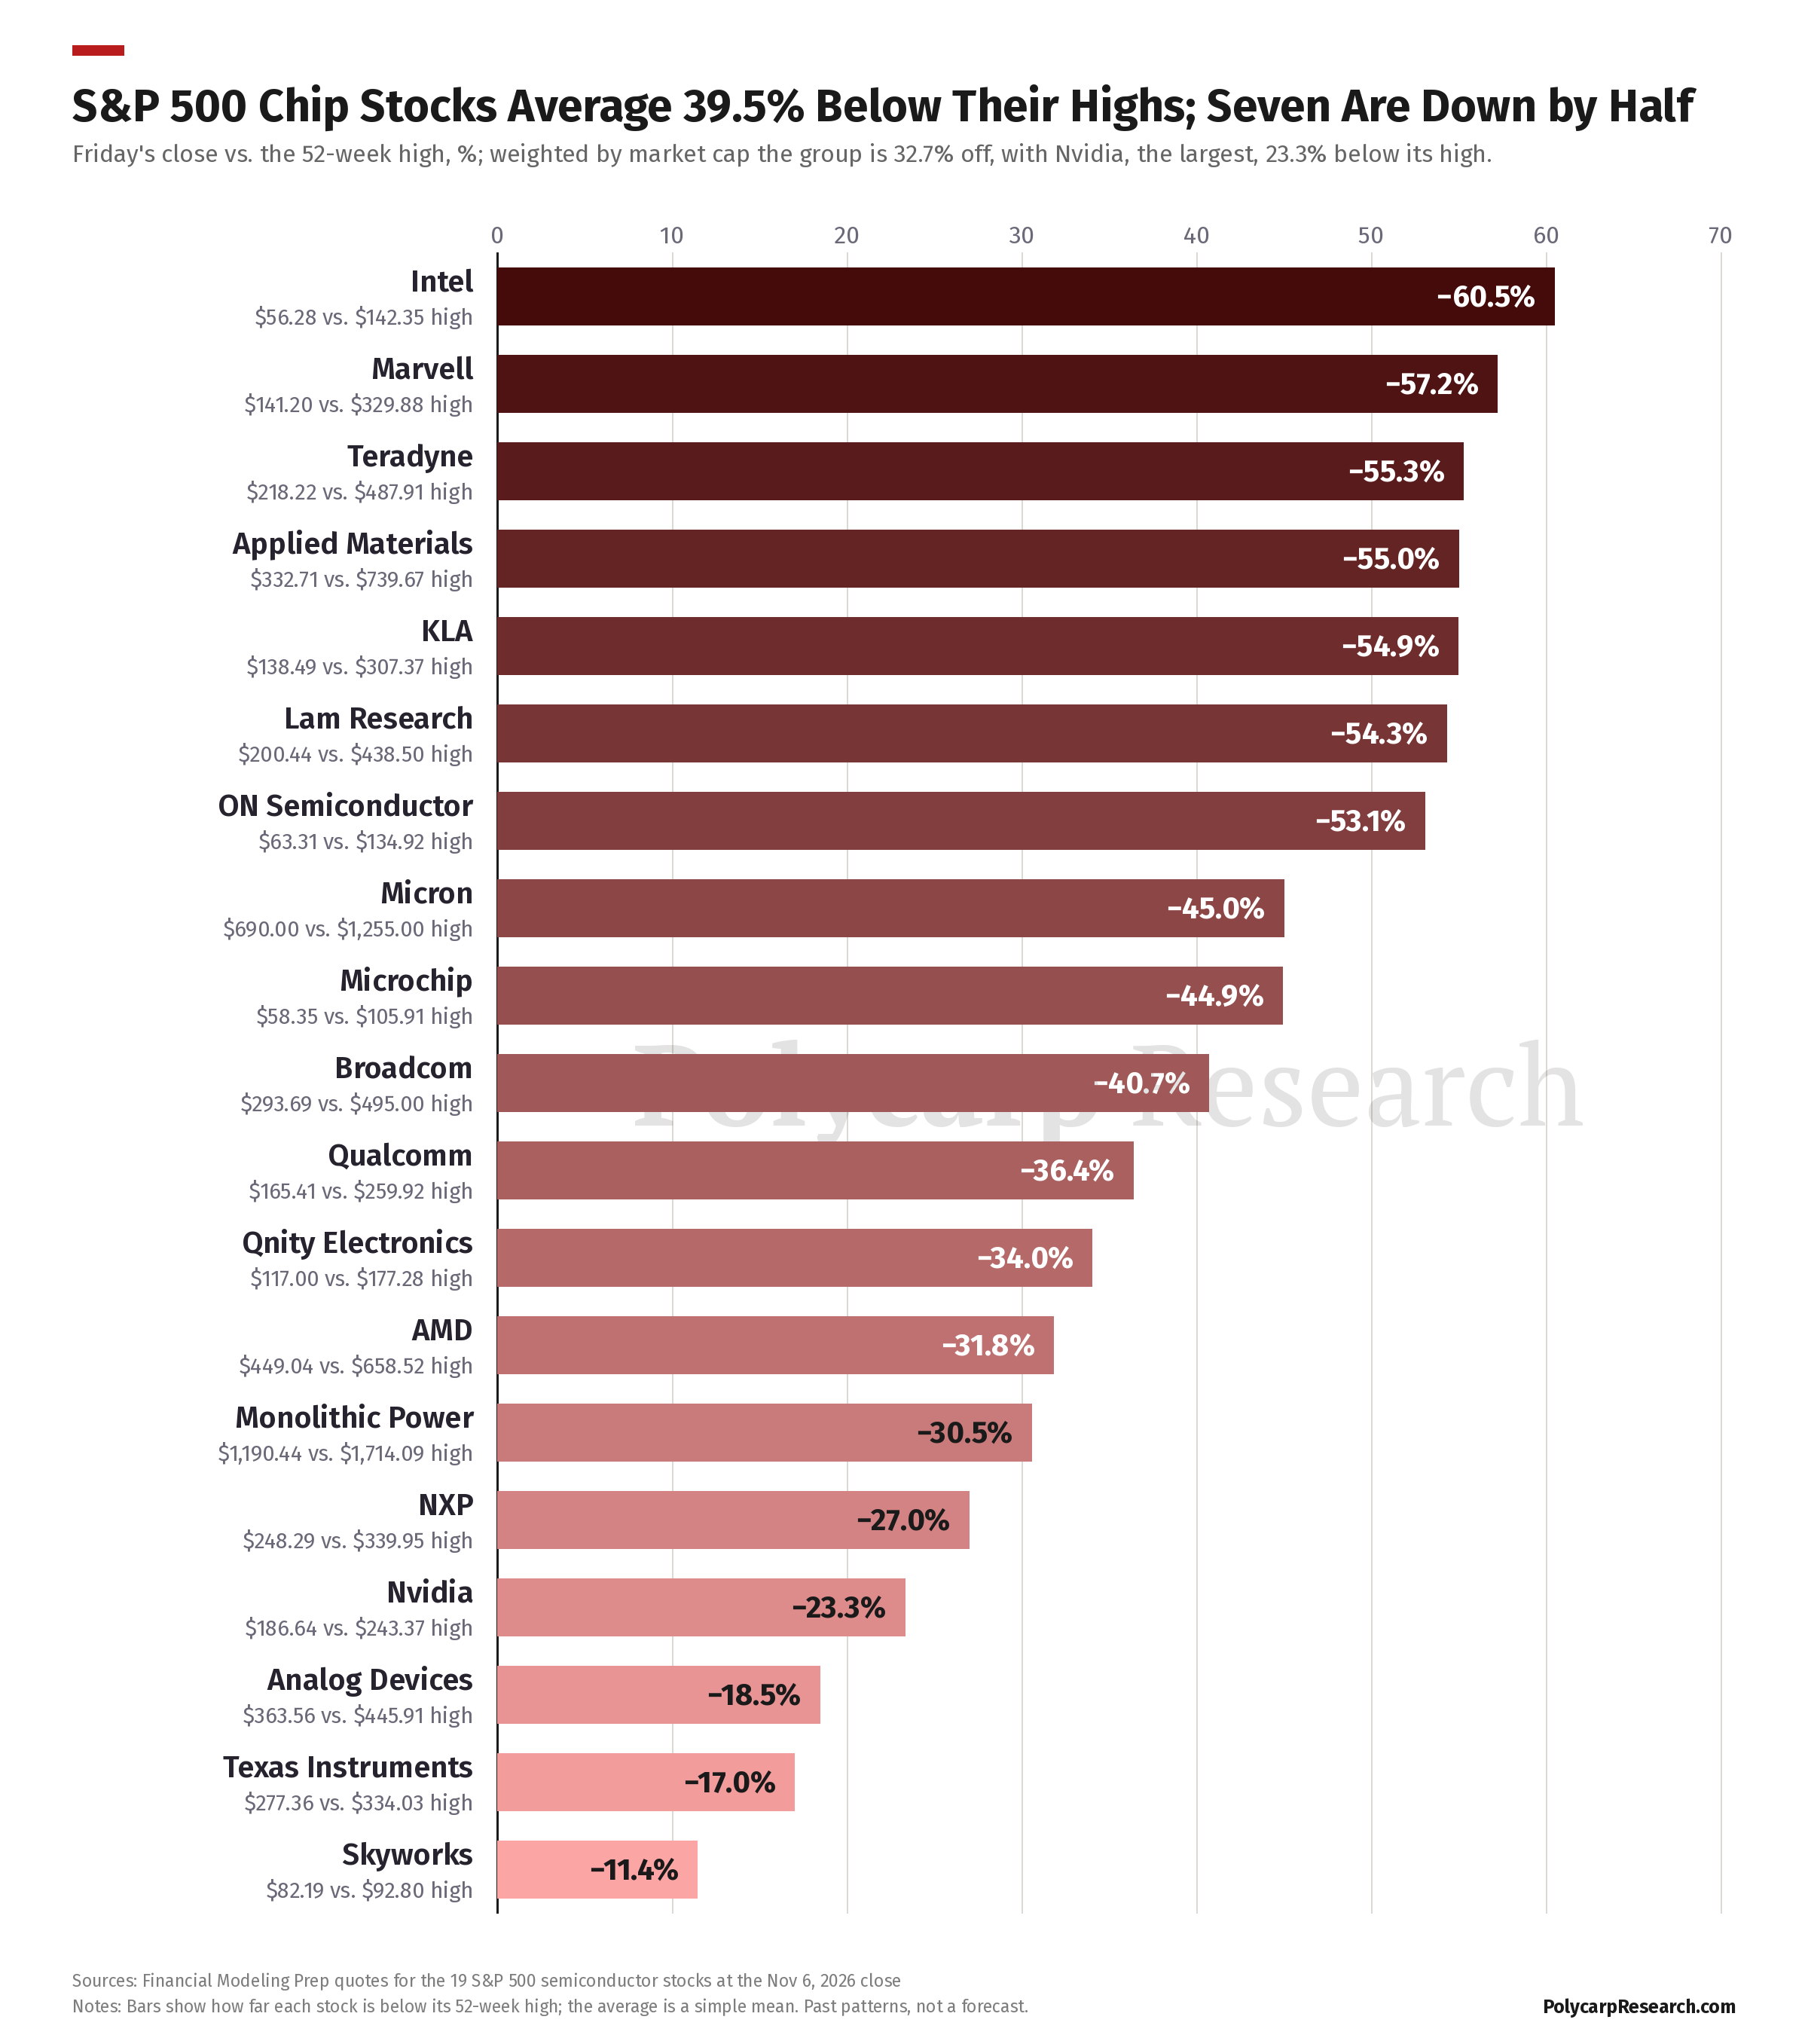
Semi’s have had an incredible amount of damage done with the average chip stock down nearly 40%! If the market leaders have topped for this cycle, that is a huge risk for the market.
Catalyst
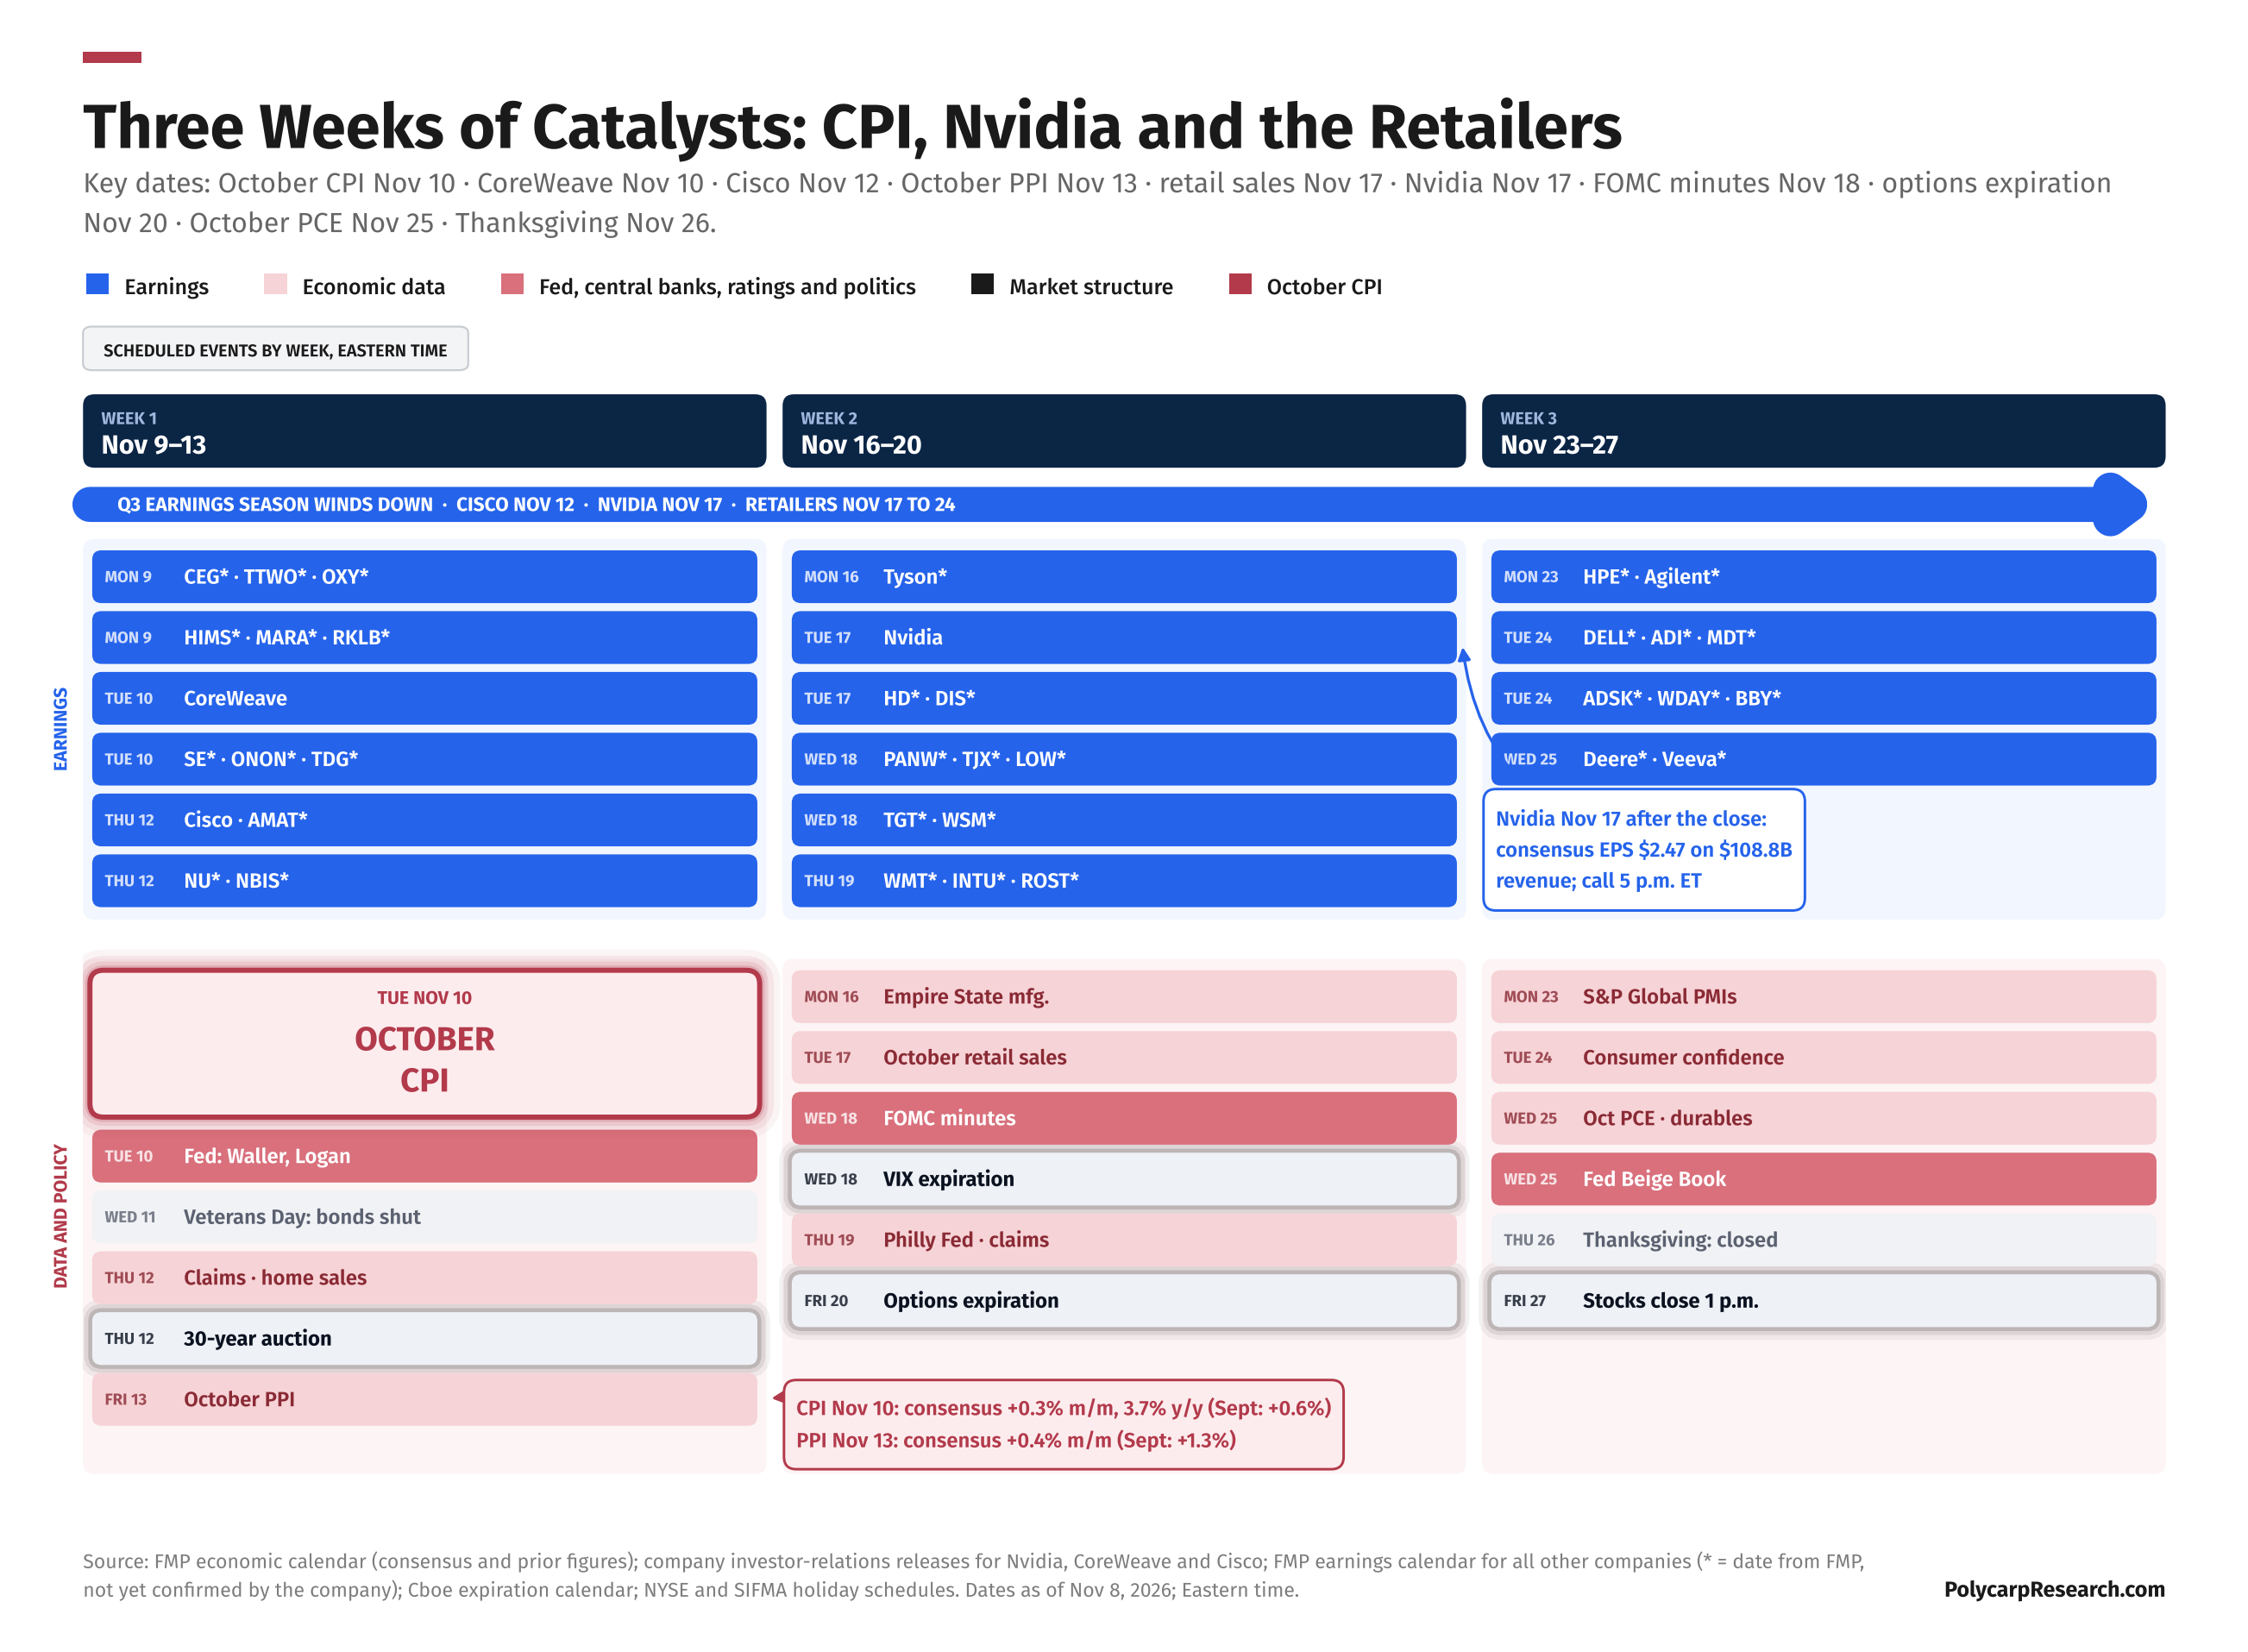
This week we have both CPI and PPI that can influence the market. Next week Nvidia earnings will tell us a lot. Nvidia matters for more than its own price. With so much damage across semiconductors, the response to its results will test whether investors still reward AI demand or use good news to reduce exposure.
Levels of Caution
I’m always preaching about the benefits of having a plan in any market environment, any trade you might enter, and having the levels that influence your decisions mapped out. Below are a few levels I am watching to add protection while also being open to the idea a bottom could already be in place.
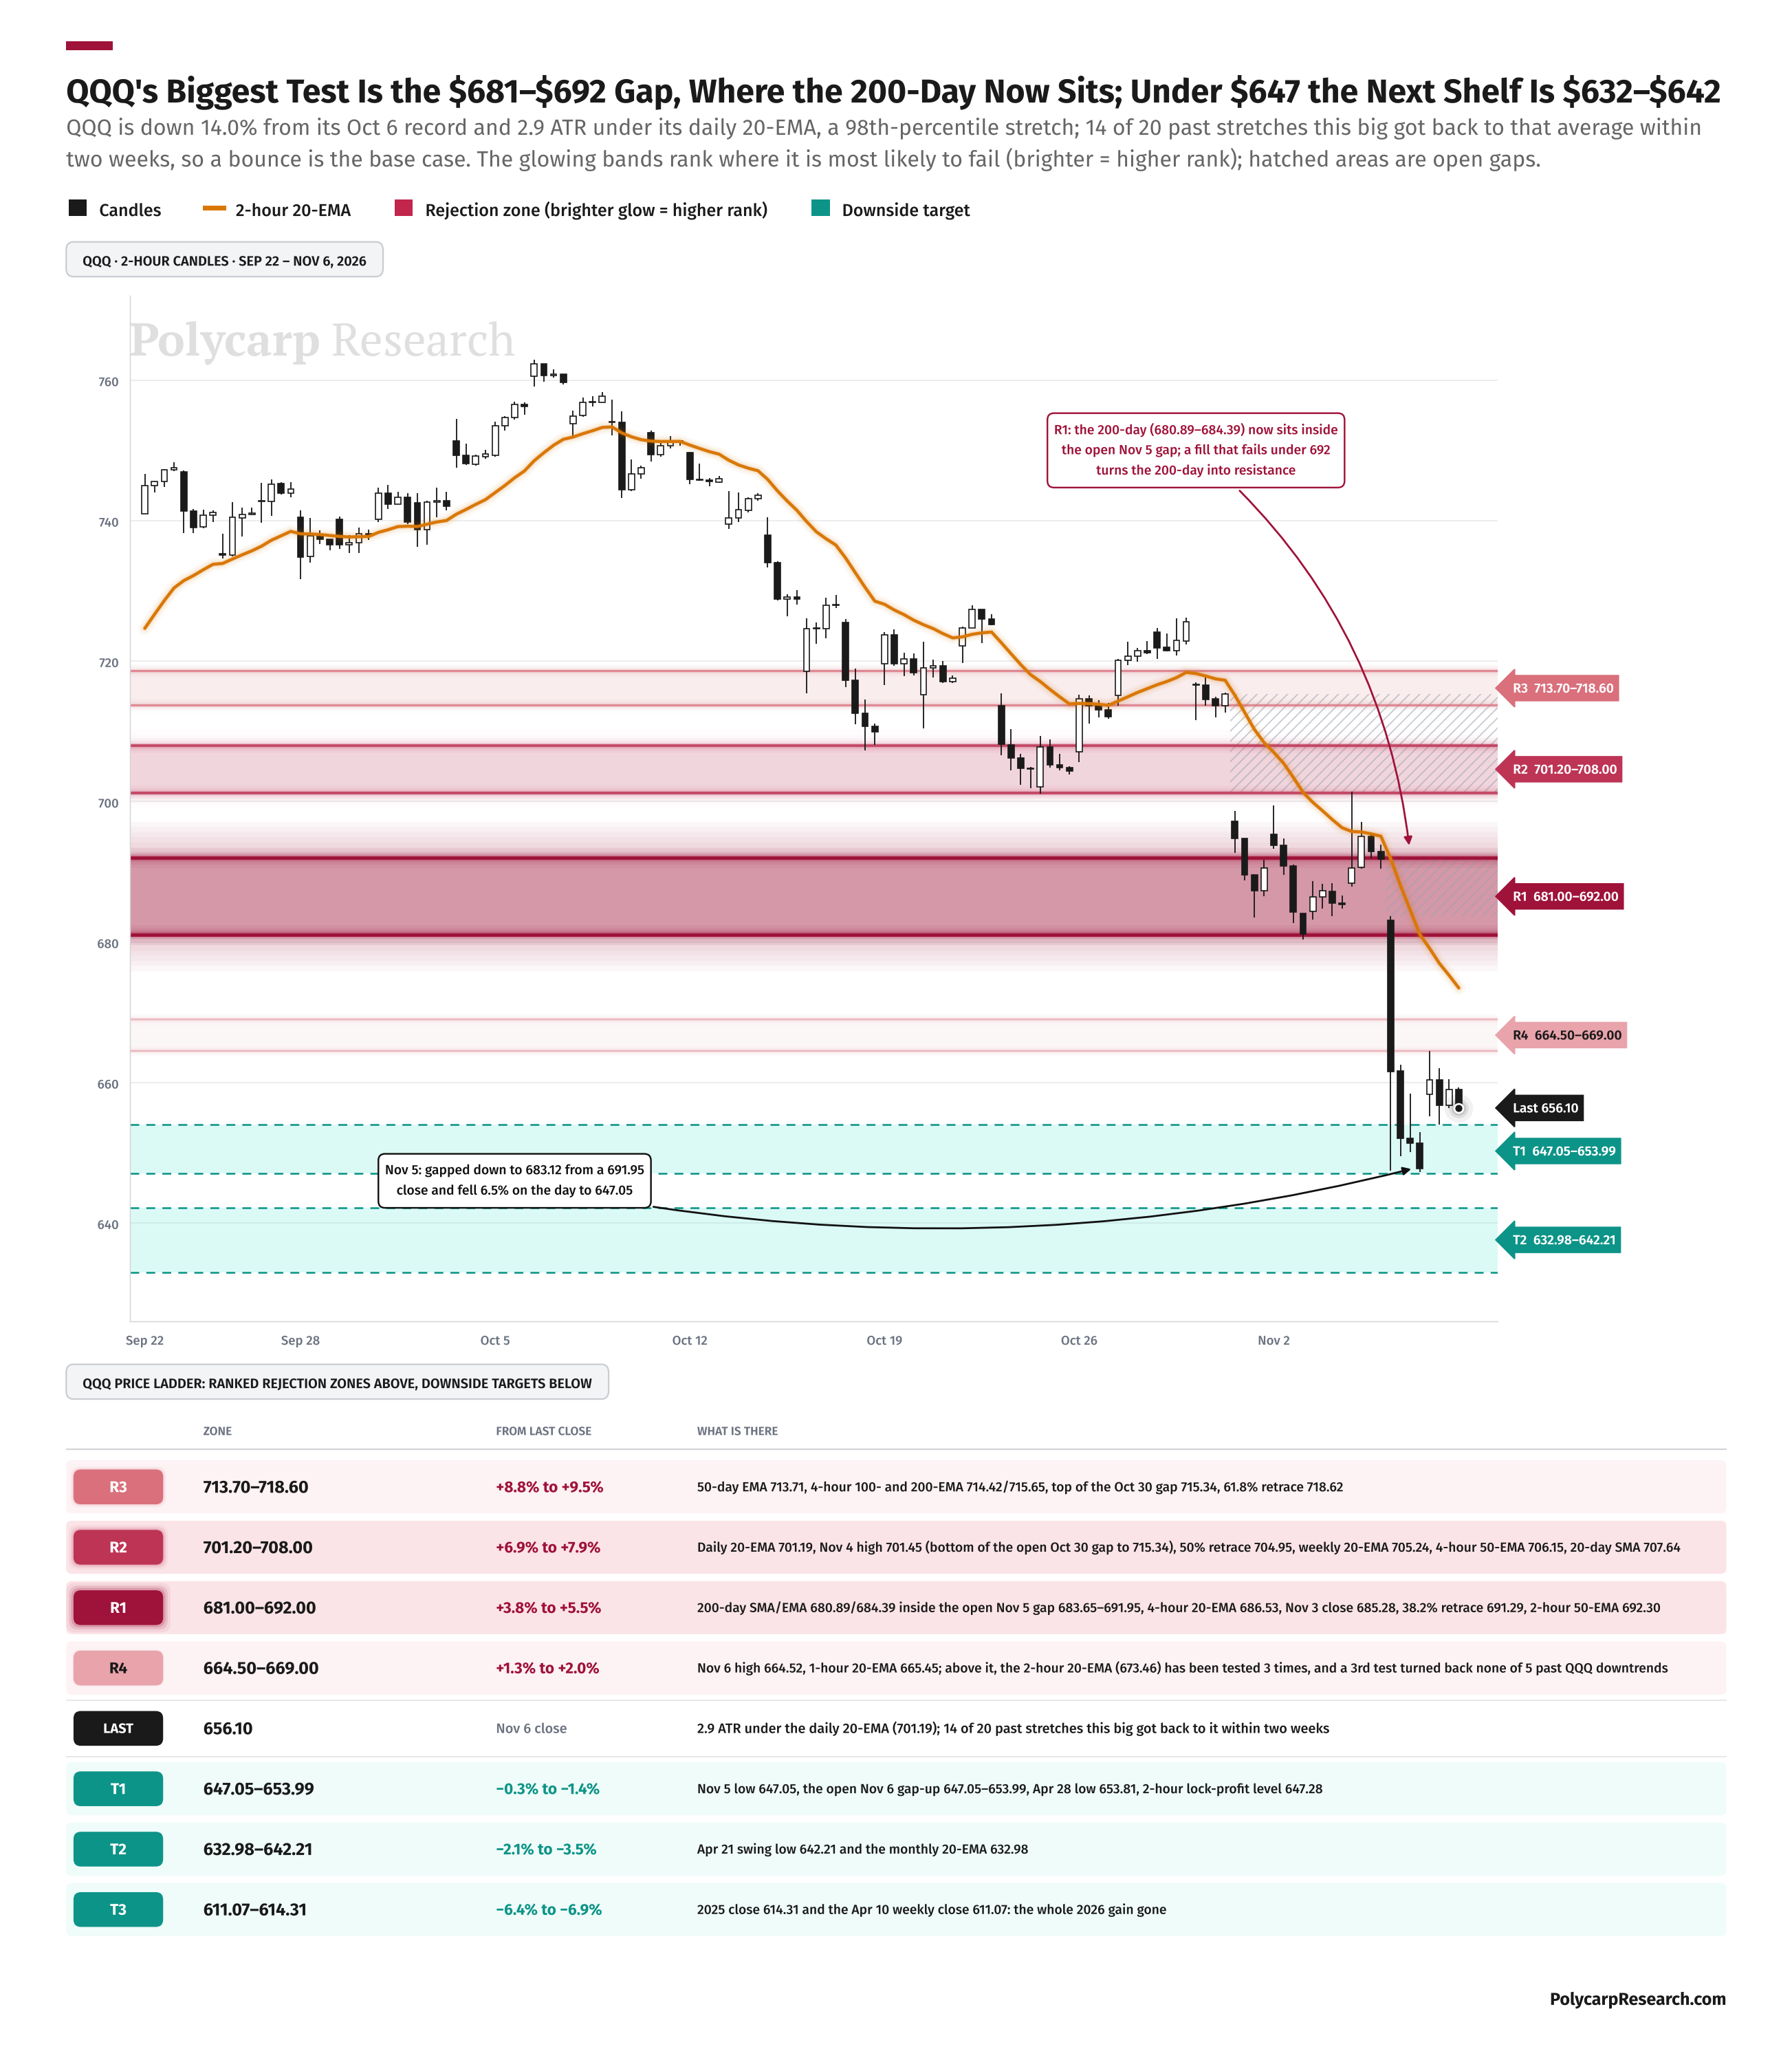
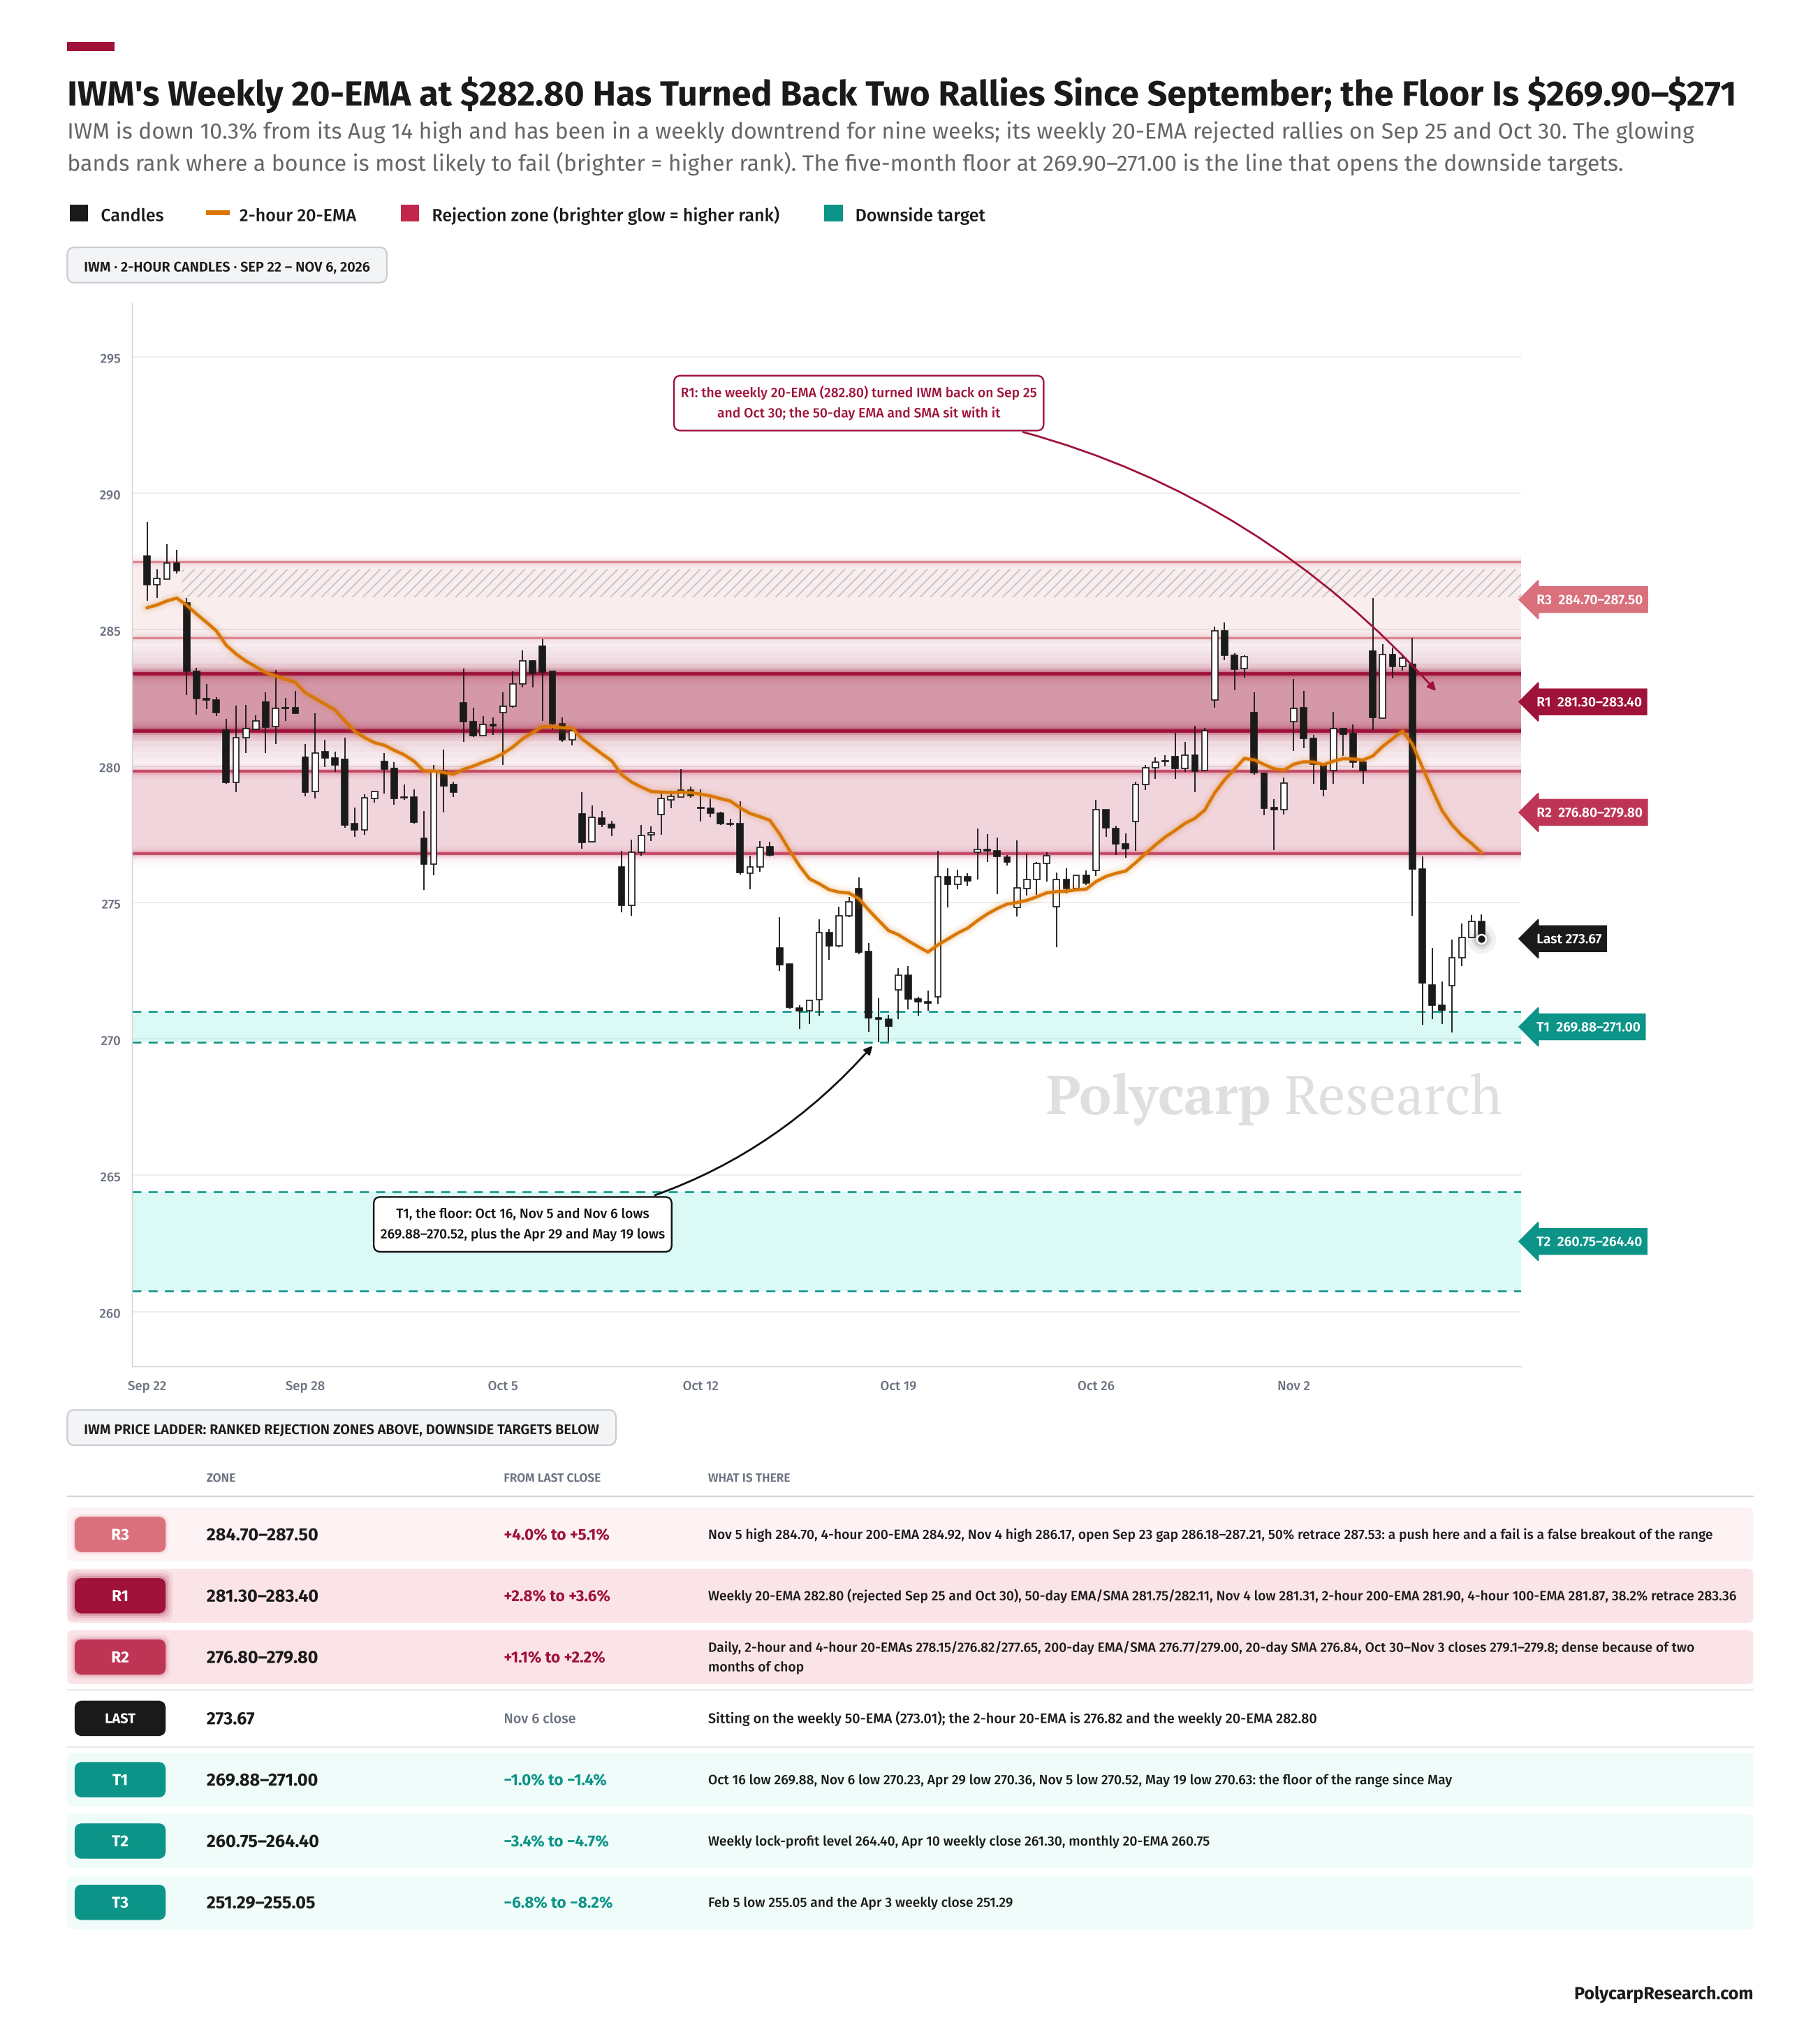
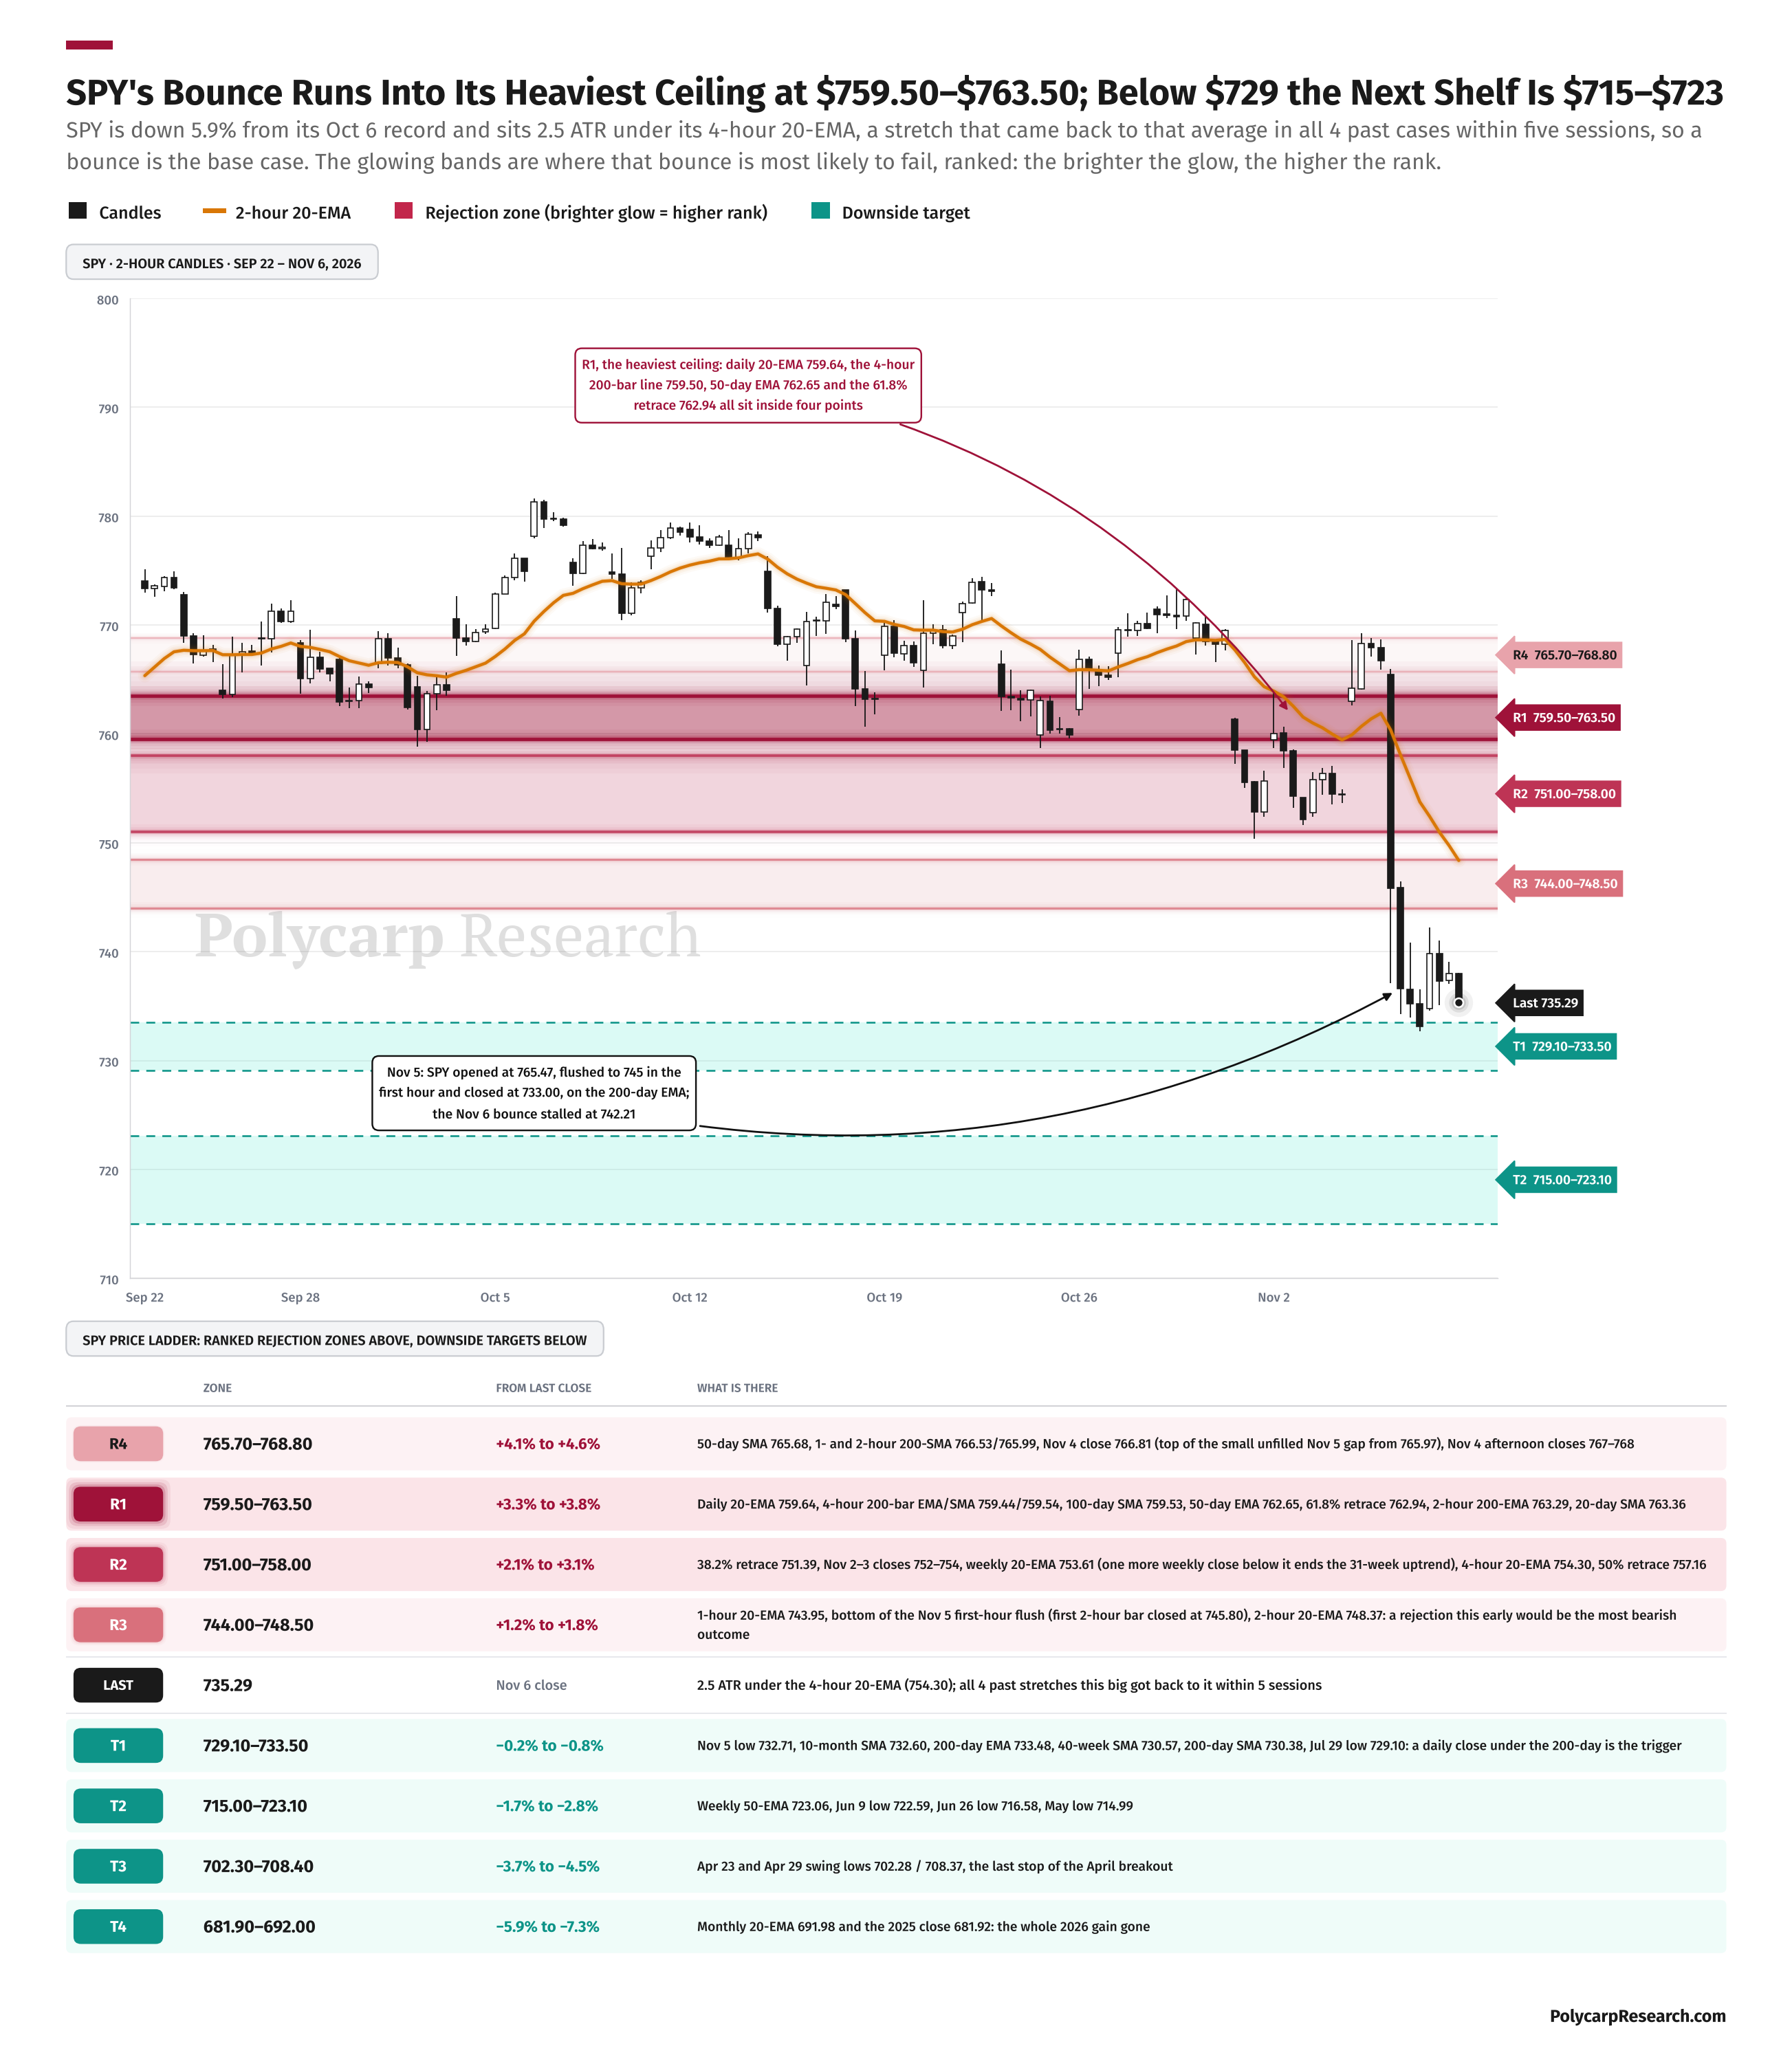
These levels are included each week and can be found on the website along with our weekly signals
Quick announcement.
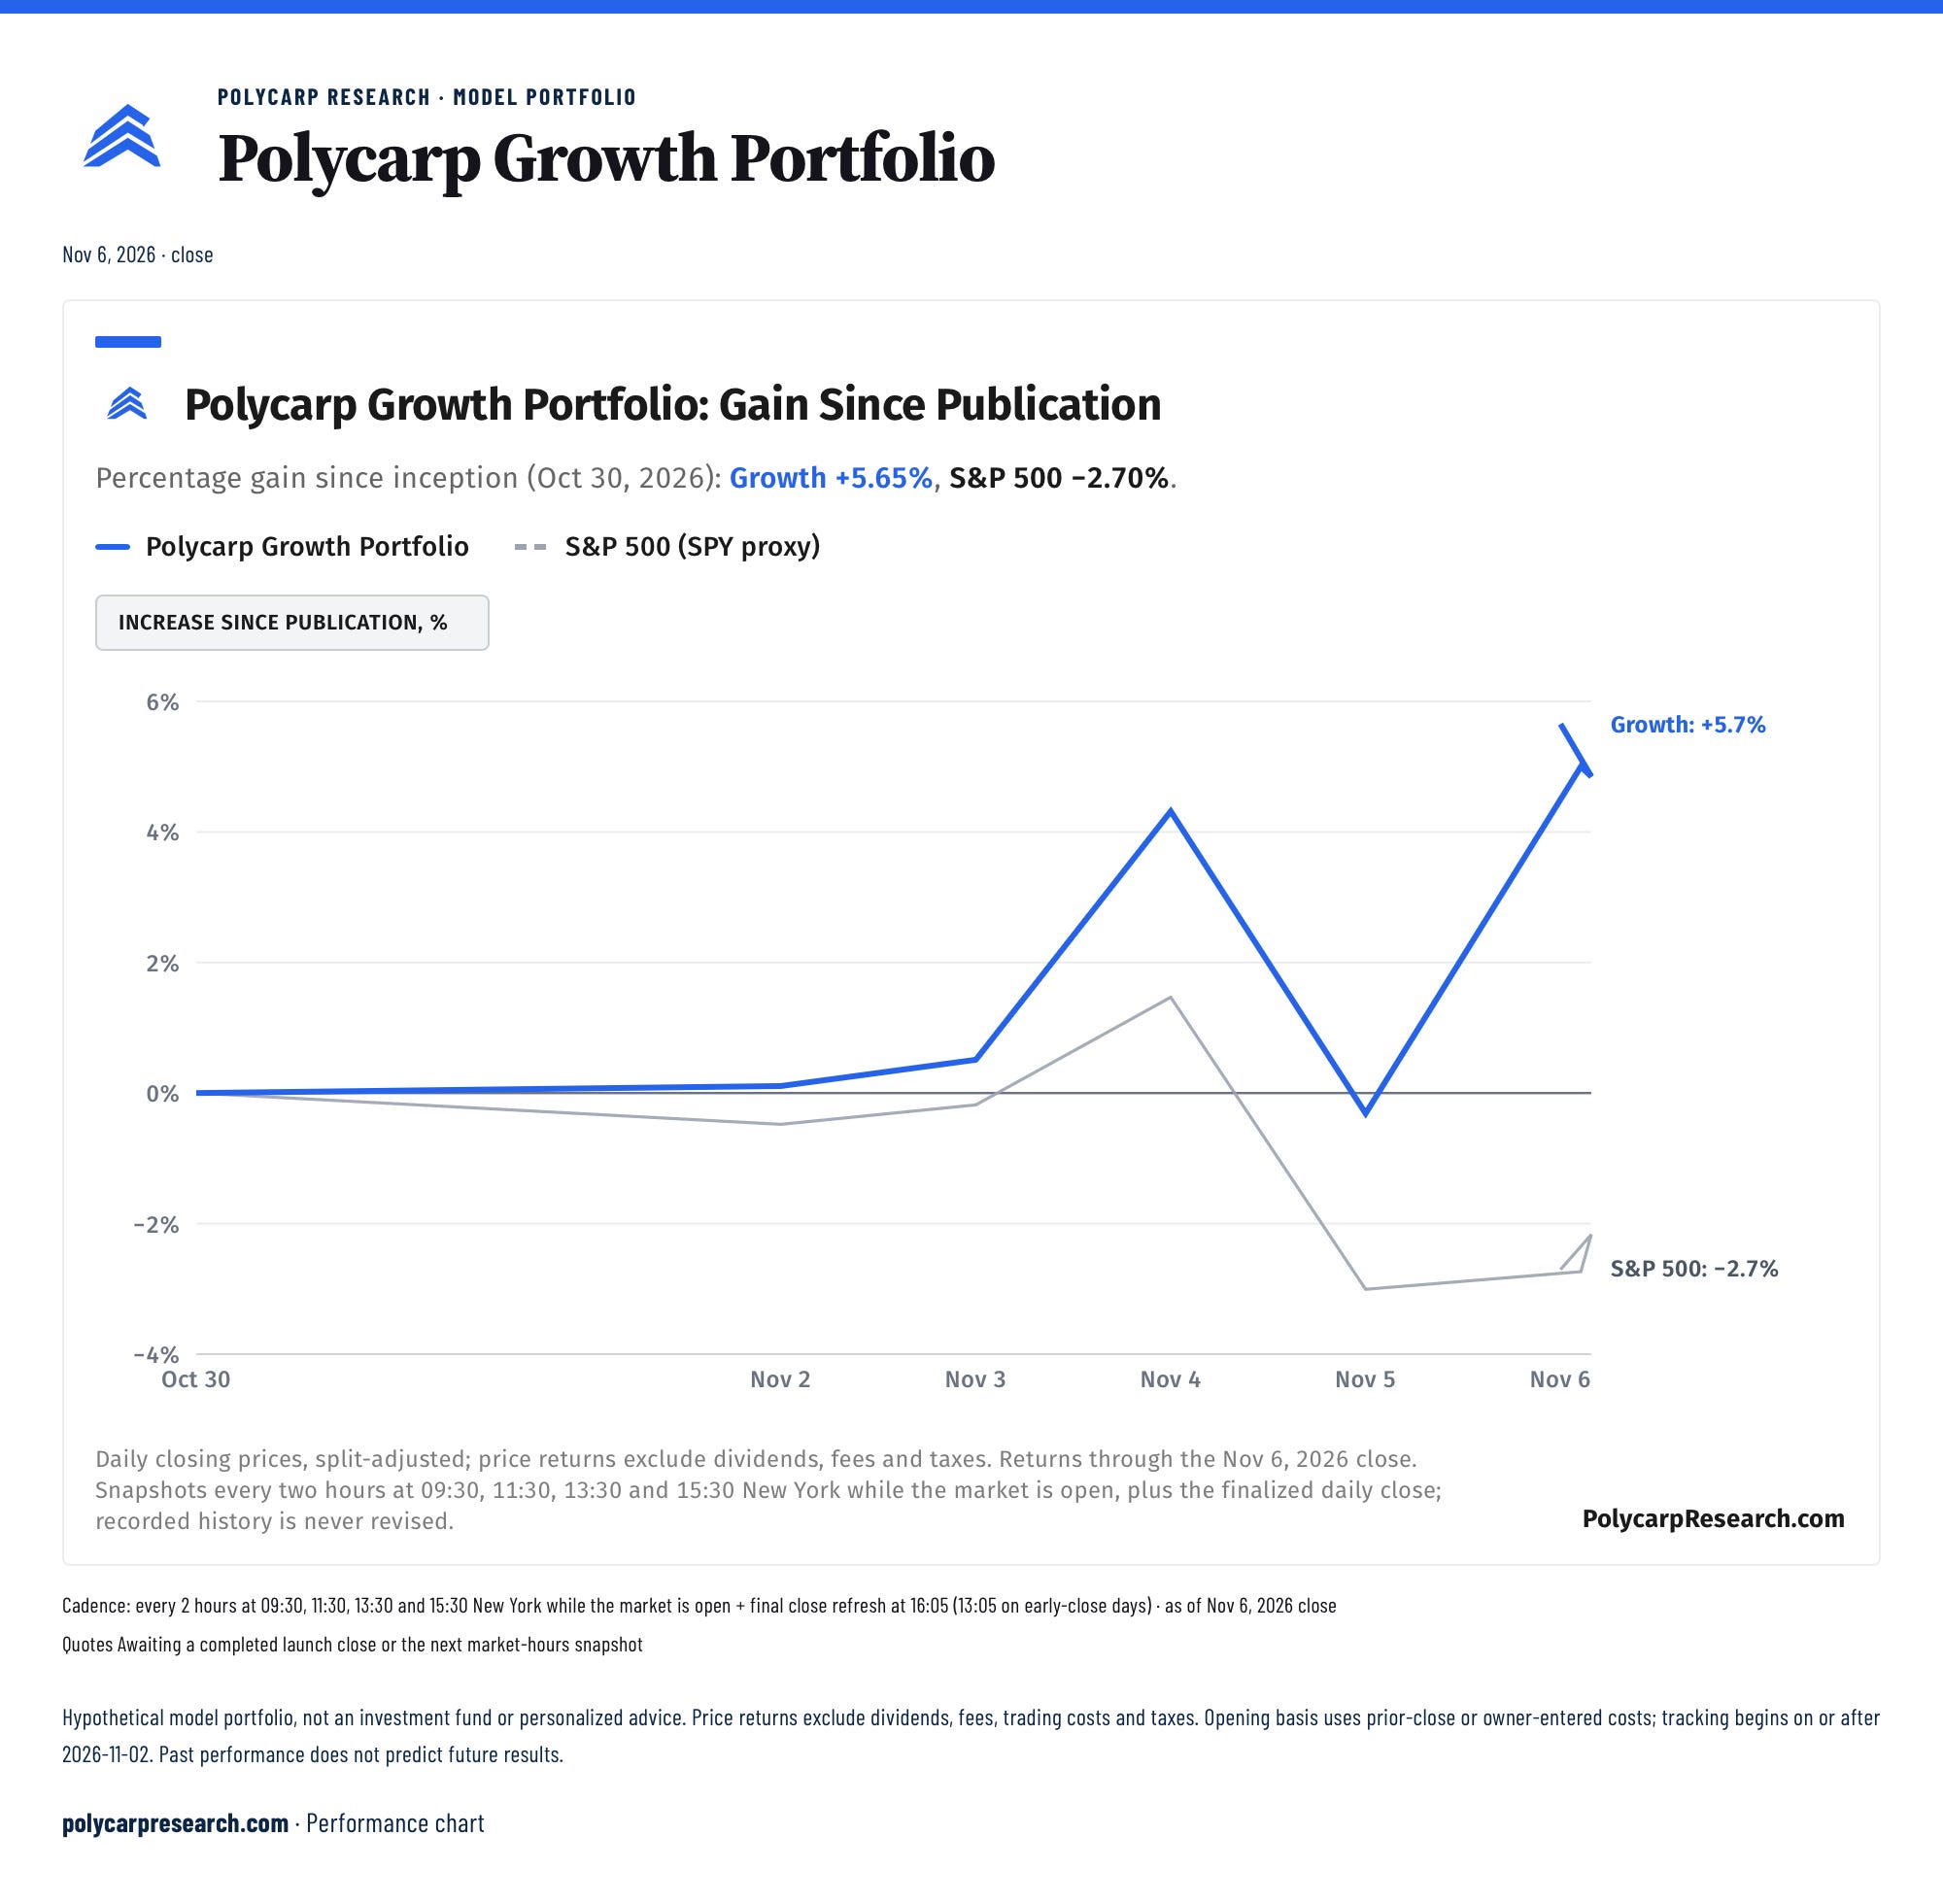
Polycarp Portfolios are live: four model portfolios (Growth, Core, Core + Growth, Biotech) plus an ETF build, every one benchmarked against the S&P 500 and tracked in the open.
To mark the launch, every paid Substack subscriber gets full access to the portfolios, and I’m cutting the price to $10 a month ($100 for a full year). That one subscription now covers everything on the new platform:the daily dashboards, the trading tools, the deep-dive reports, the morning briefs and the one-page chart notes. This window will only happen for a short time. (2 Weeks)
If you’ve been on the fence, this is the cheapest it will be.
Key Signals
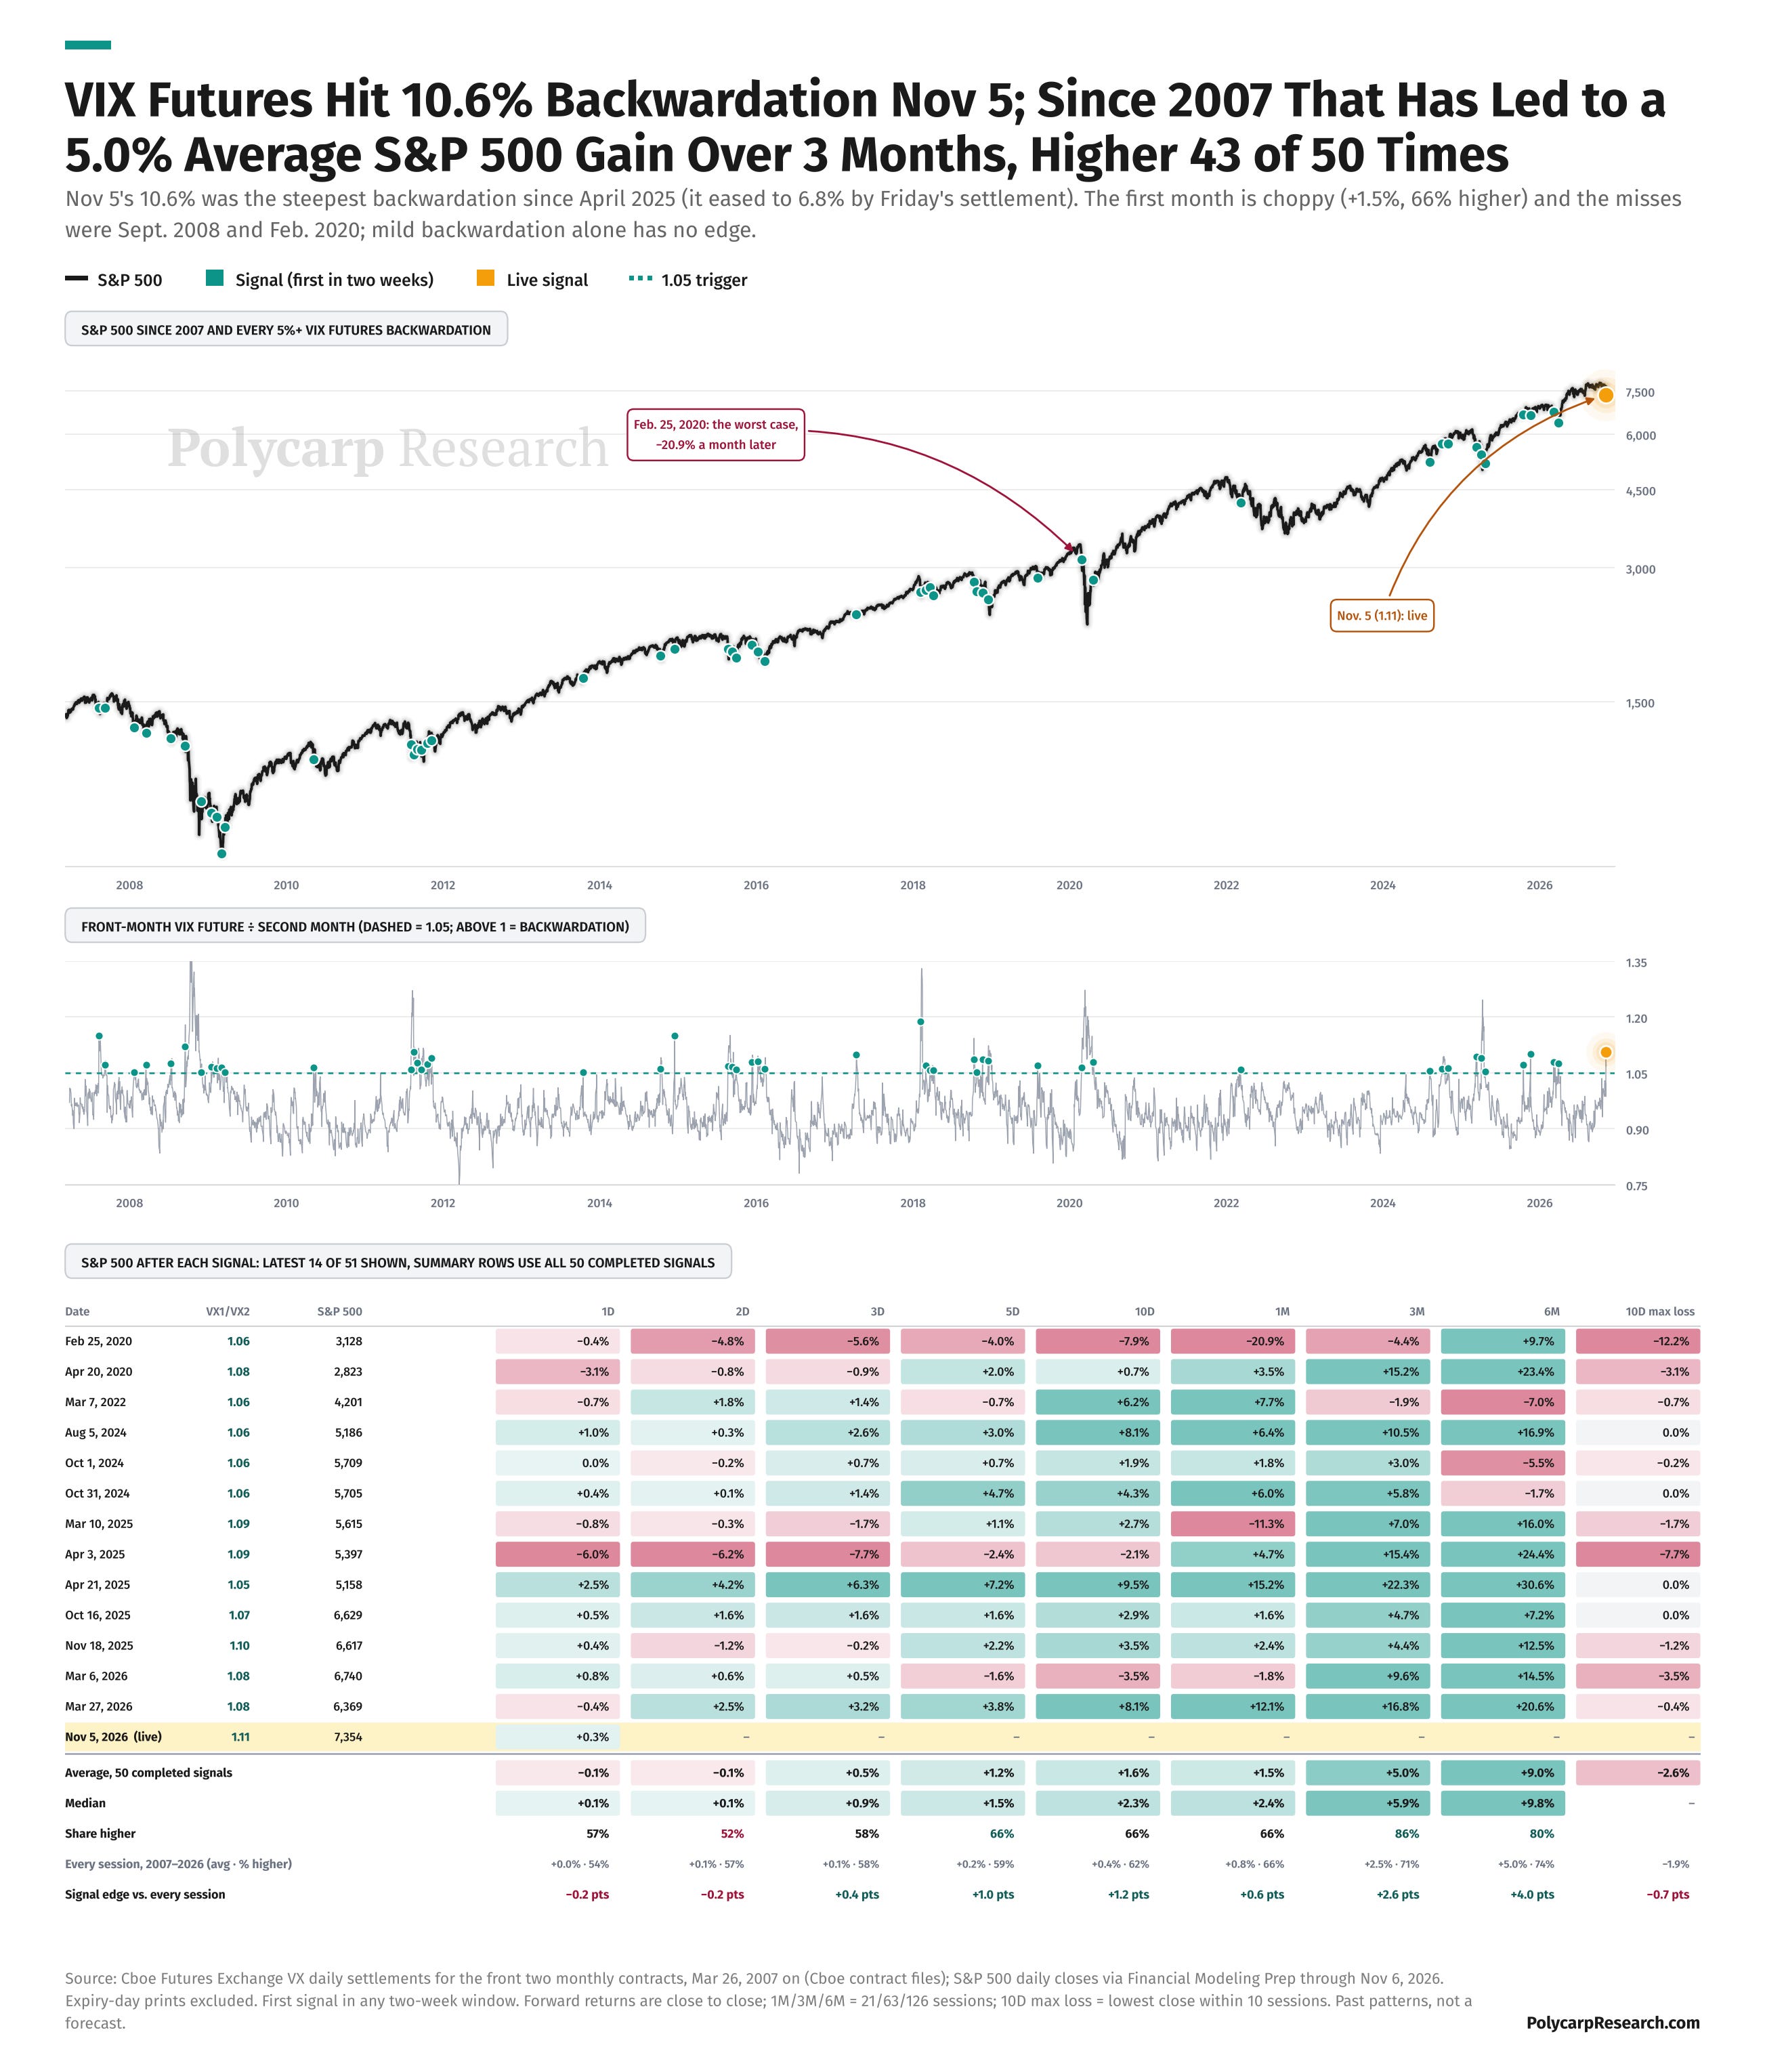
The technical damage is substantial, but sentiment and positioning signals suggest the downside is no longer an undiscovered story. Looking at the VIX, similar readings led the malted higher 43 of 50 times 3 months later. But it was a choppy experience with shorter time frames not as bullish.
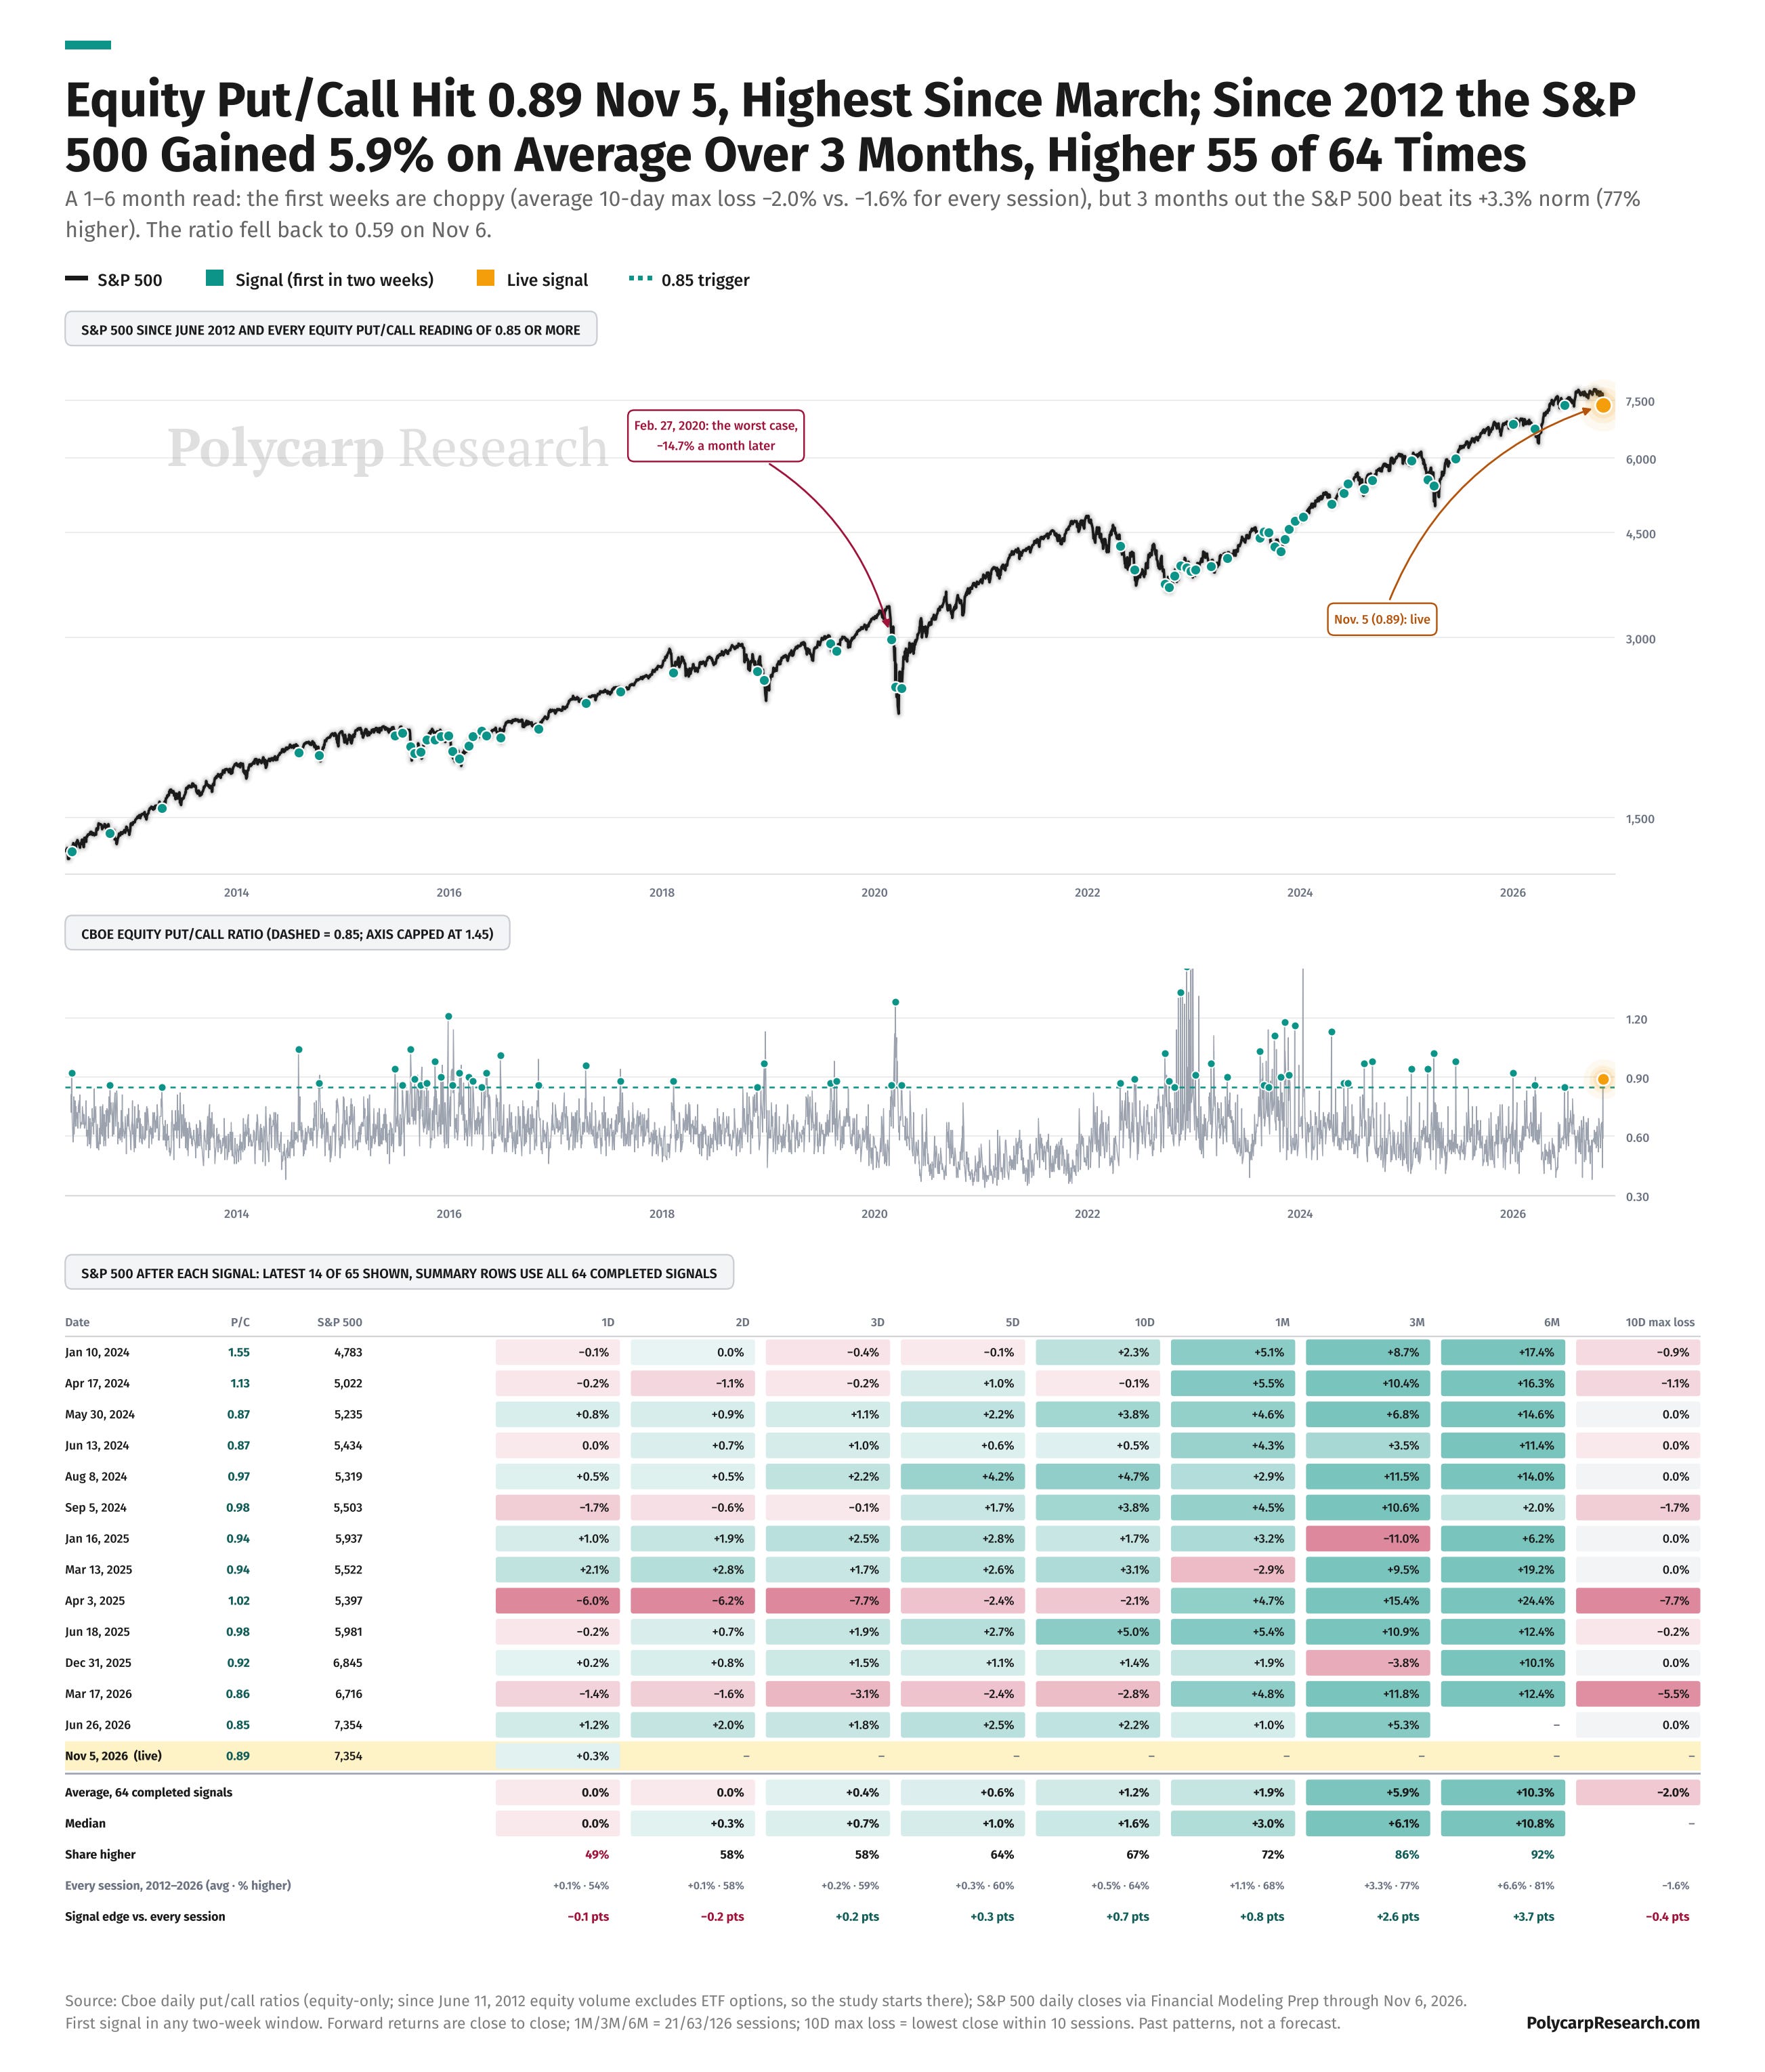
The equity put/call ratio reached 0.89 on November 5, its highest reading since March, before falling to 0.59 on November 6. After the study's 64 completed signals at 0.85 or higher, the S&P 500 averaged +5.9% at three months and was higher 55 times. Short-term conditions were less comfortable: the average worst closing loss within ten sessions was 2.0%, compared with 1.6% across all sessions. A historically favorable medium-term outcome can still begin with an uncomfortable entry.
Seasonality
The historical tailwind is not a promise of an immediate recovery but one more data point to leverage in any thesis. My lean is that the market will be shaky but there are area’s of the market that are showing some great opportunities.
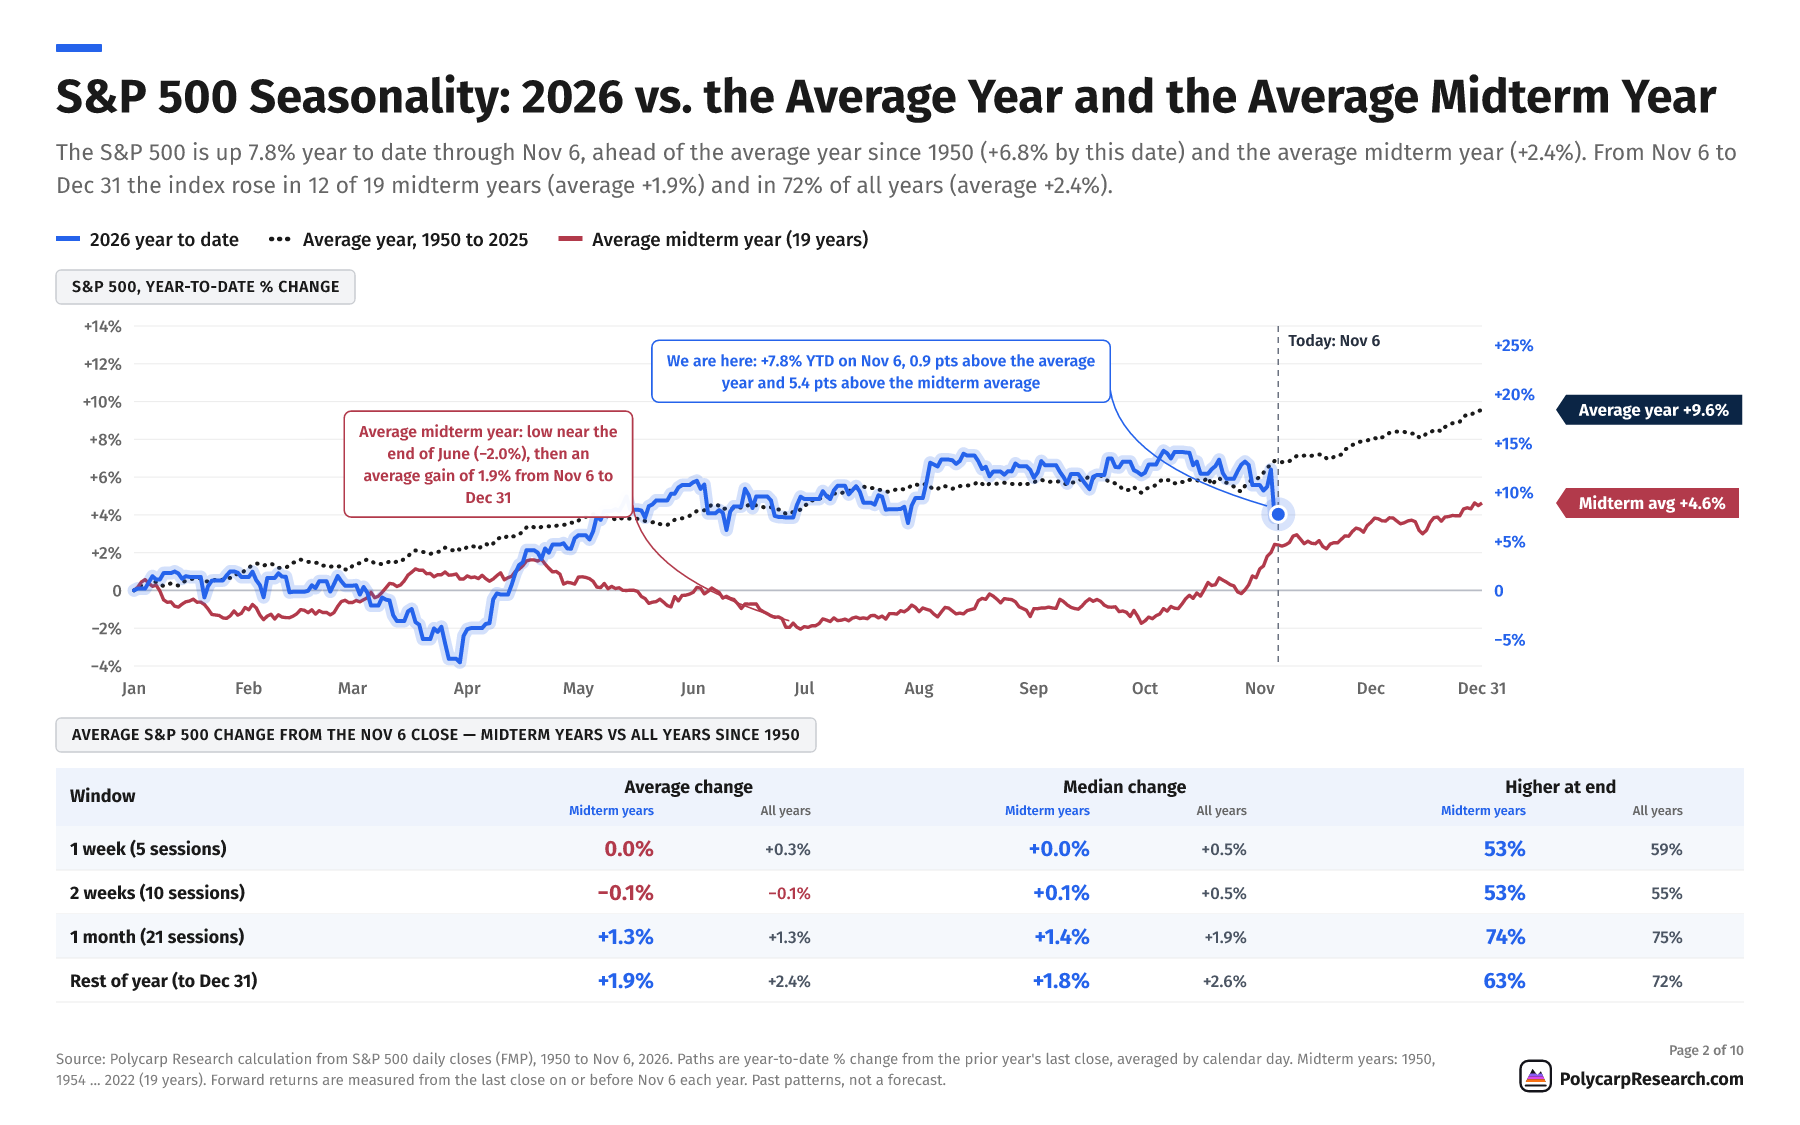
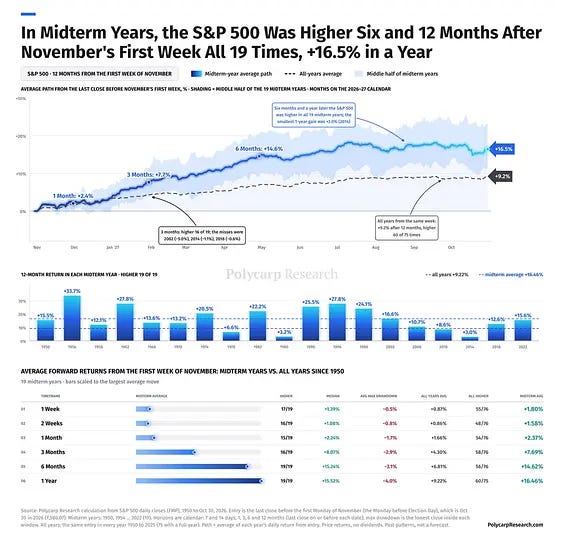
The edge of data like the November Midterm winning streak I think will lose its value over time as so many are aware of it, but that doesn’t mean I’m confident to bet against it either.
Final Thoughts
I wanted to get this quick write up out before the market kicked off but I’ll have a deeper dive later in the week with all the stocks and setups I’m watching. Last week the Polycarp Portfolios launched and I’m happy with the performance so far.