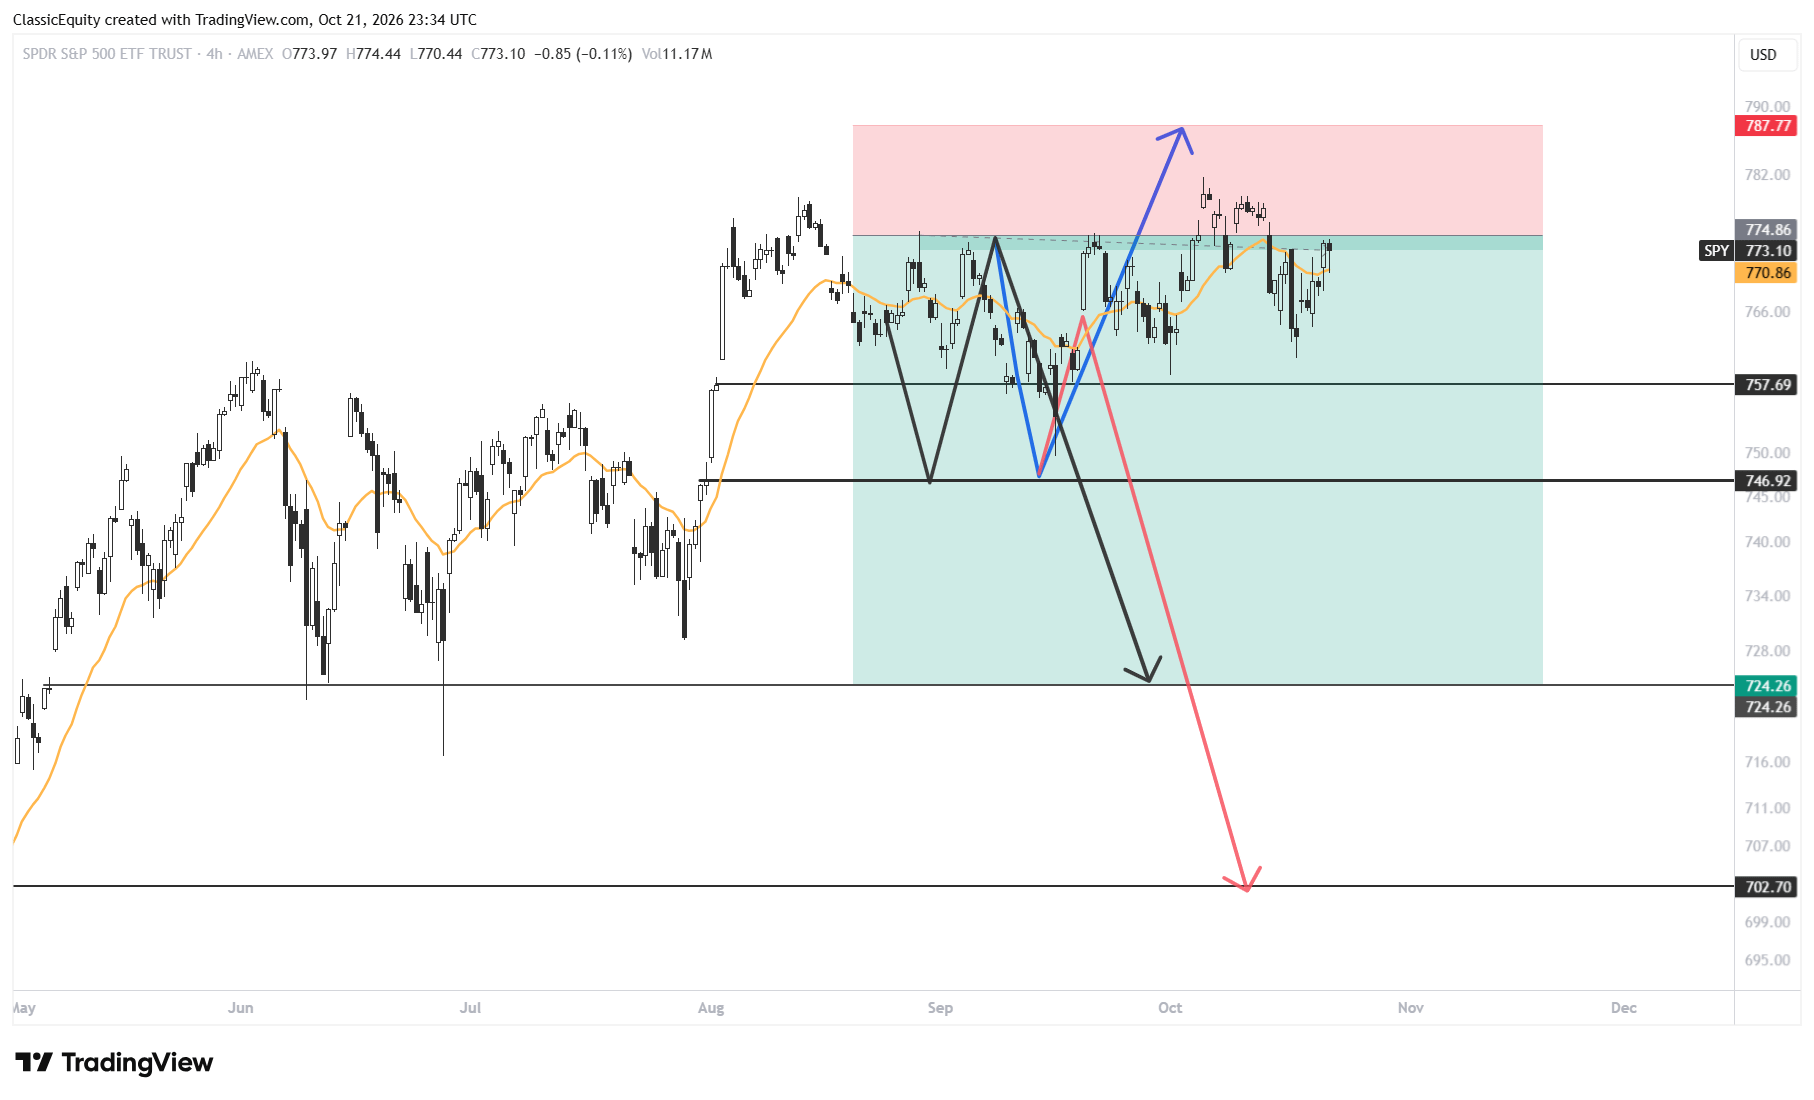
The chart below shows the index path I laid out for the S&P back in August. There are two type of corrections, correction in price, and correction in “time”. The question I am asking here is if this shows a correction in time or distribution?
S&P500
Russel (Small Caps)
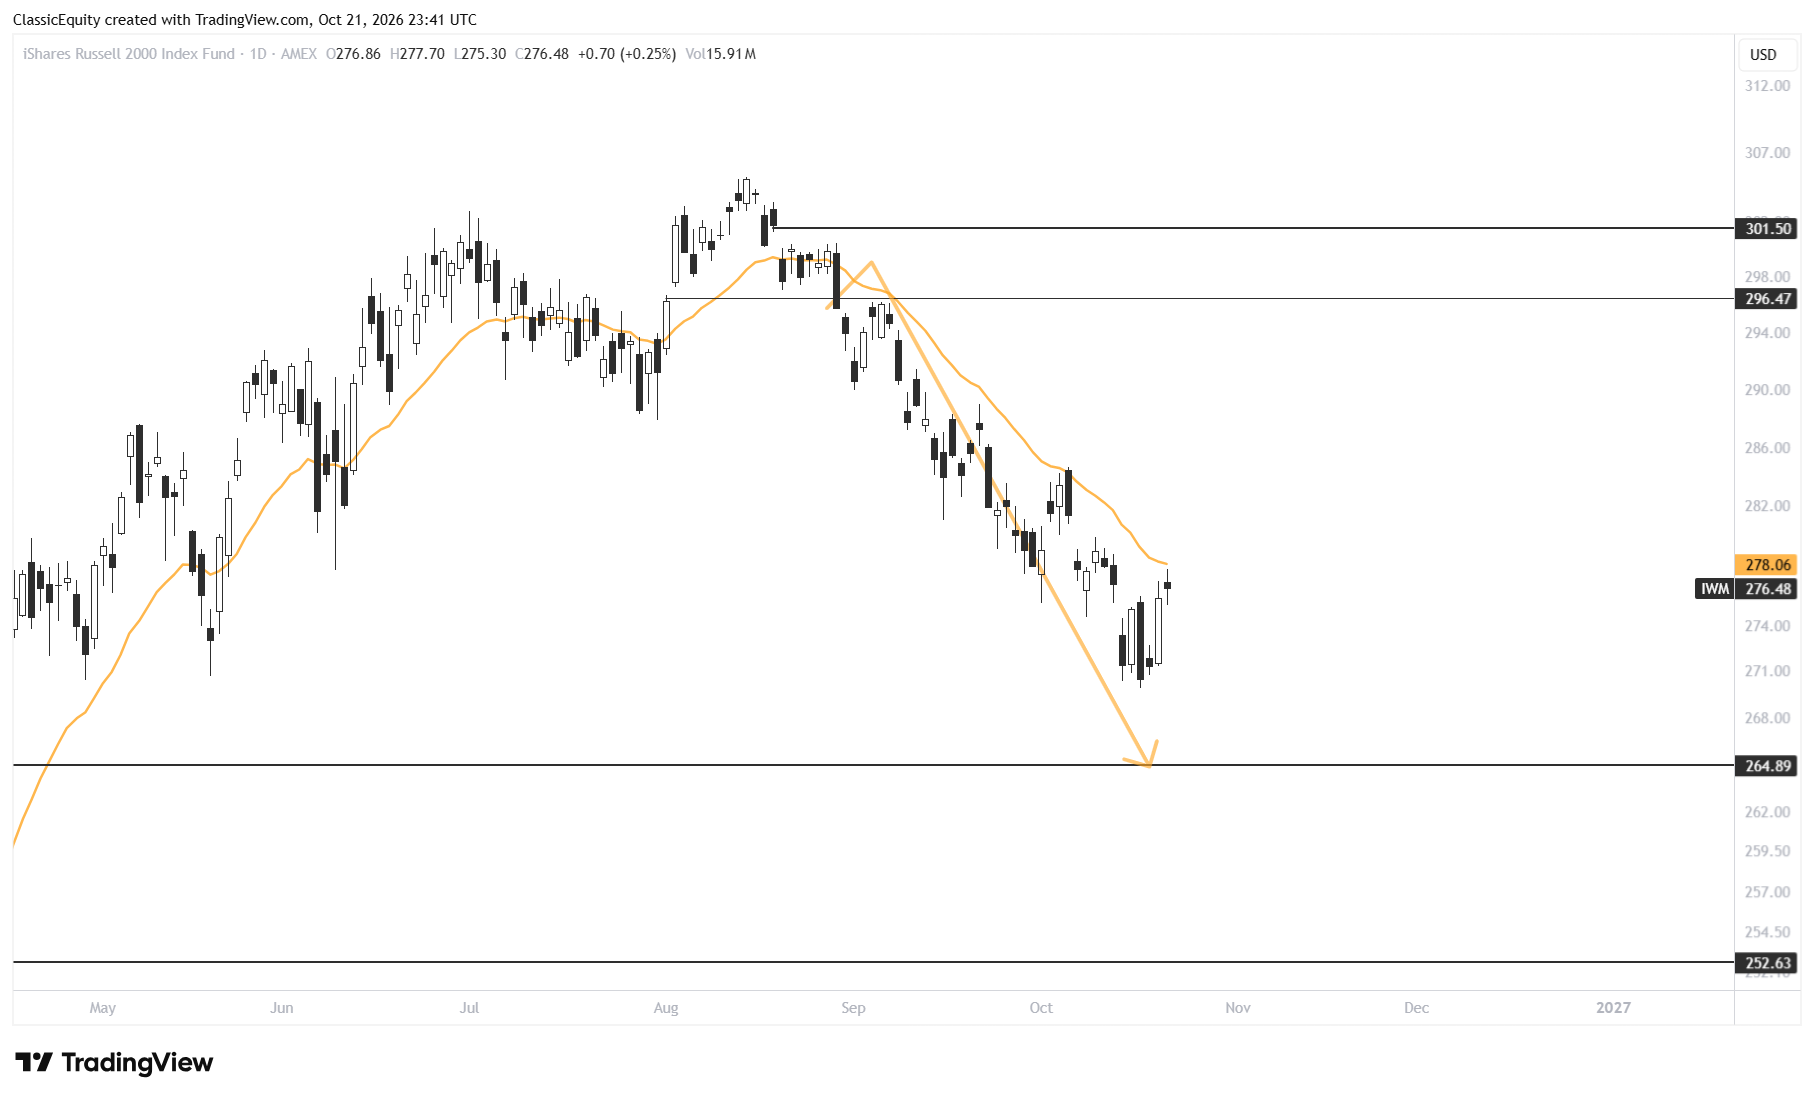
For the small caps, this was drawn back at the end of August, not bad huh?
Semiconductors
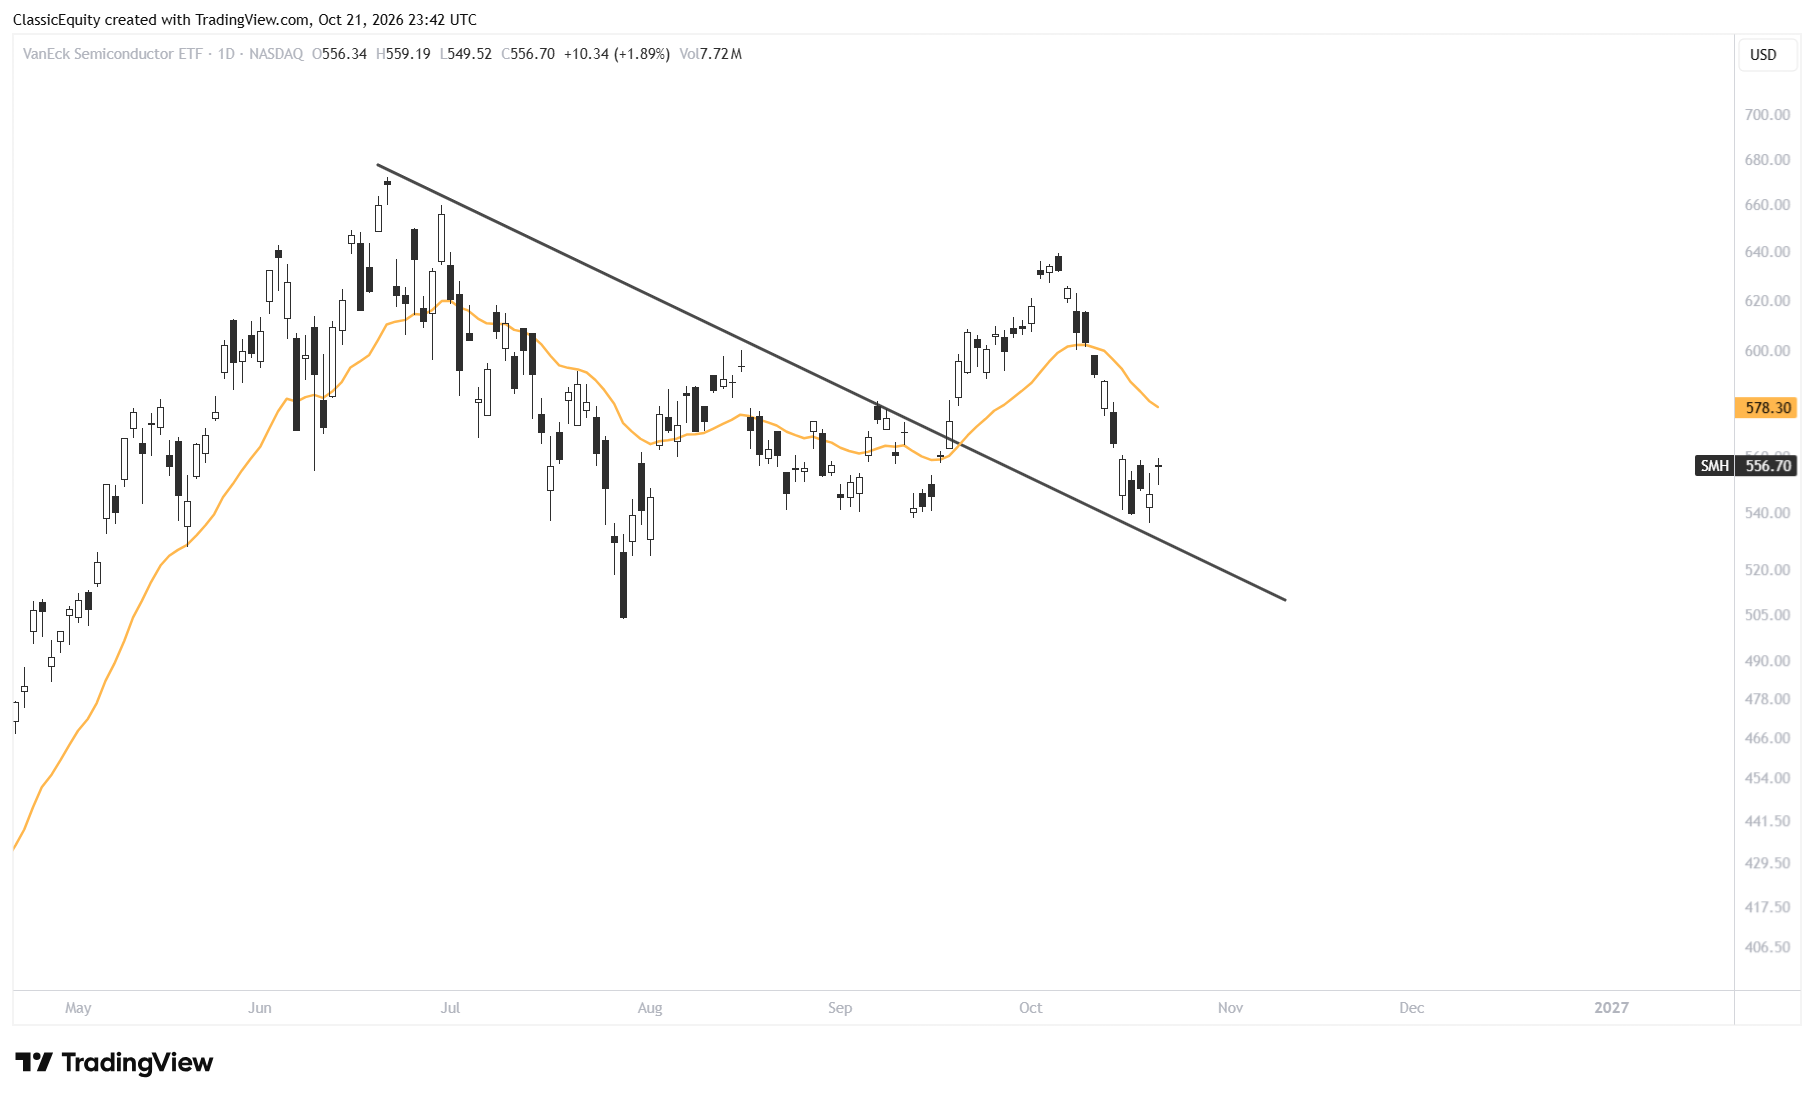
SMH ETF is showing a potential retest of the breakout
Software
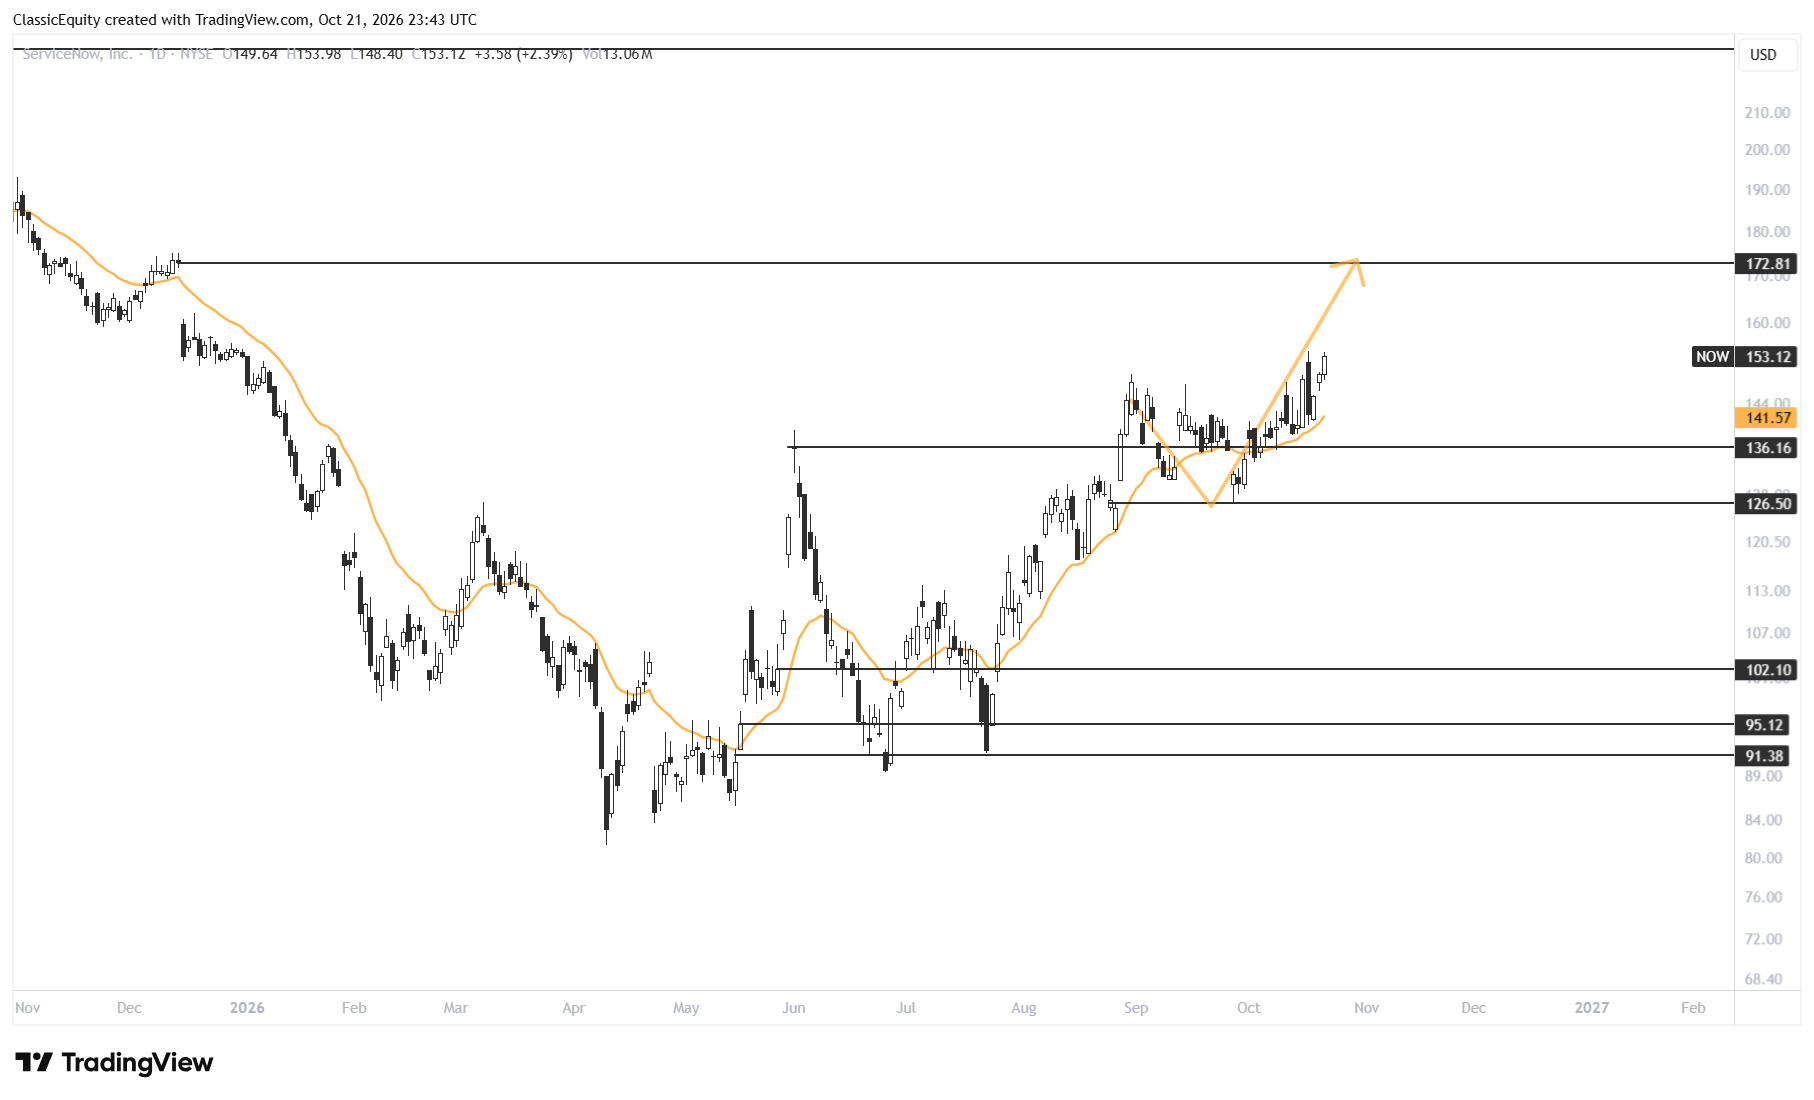
Some of my favorite software names continue to shine despite the market volatility, ServiceNow below has been a core holding since April. This chart was also drawn at the end of August
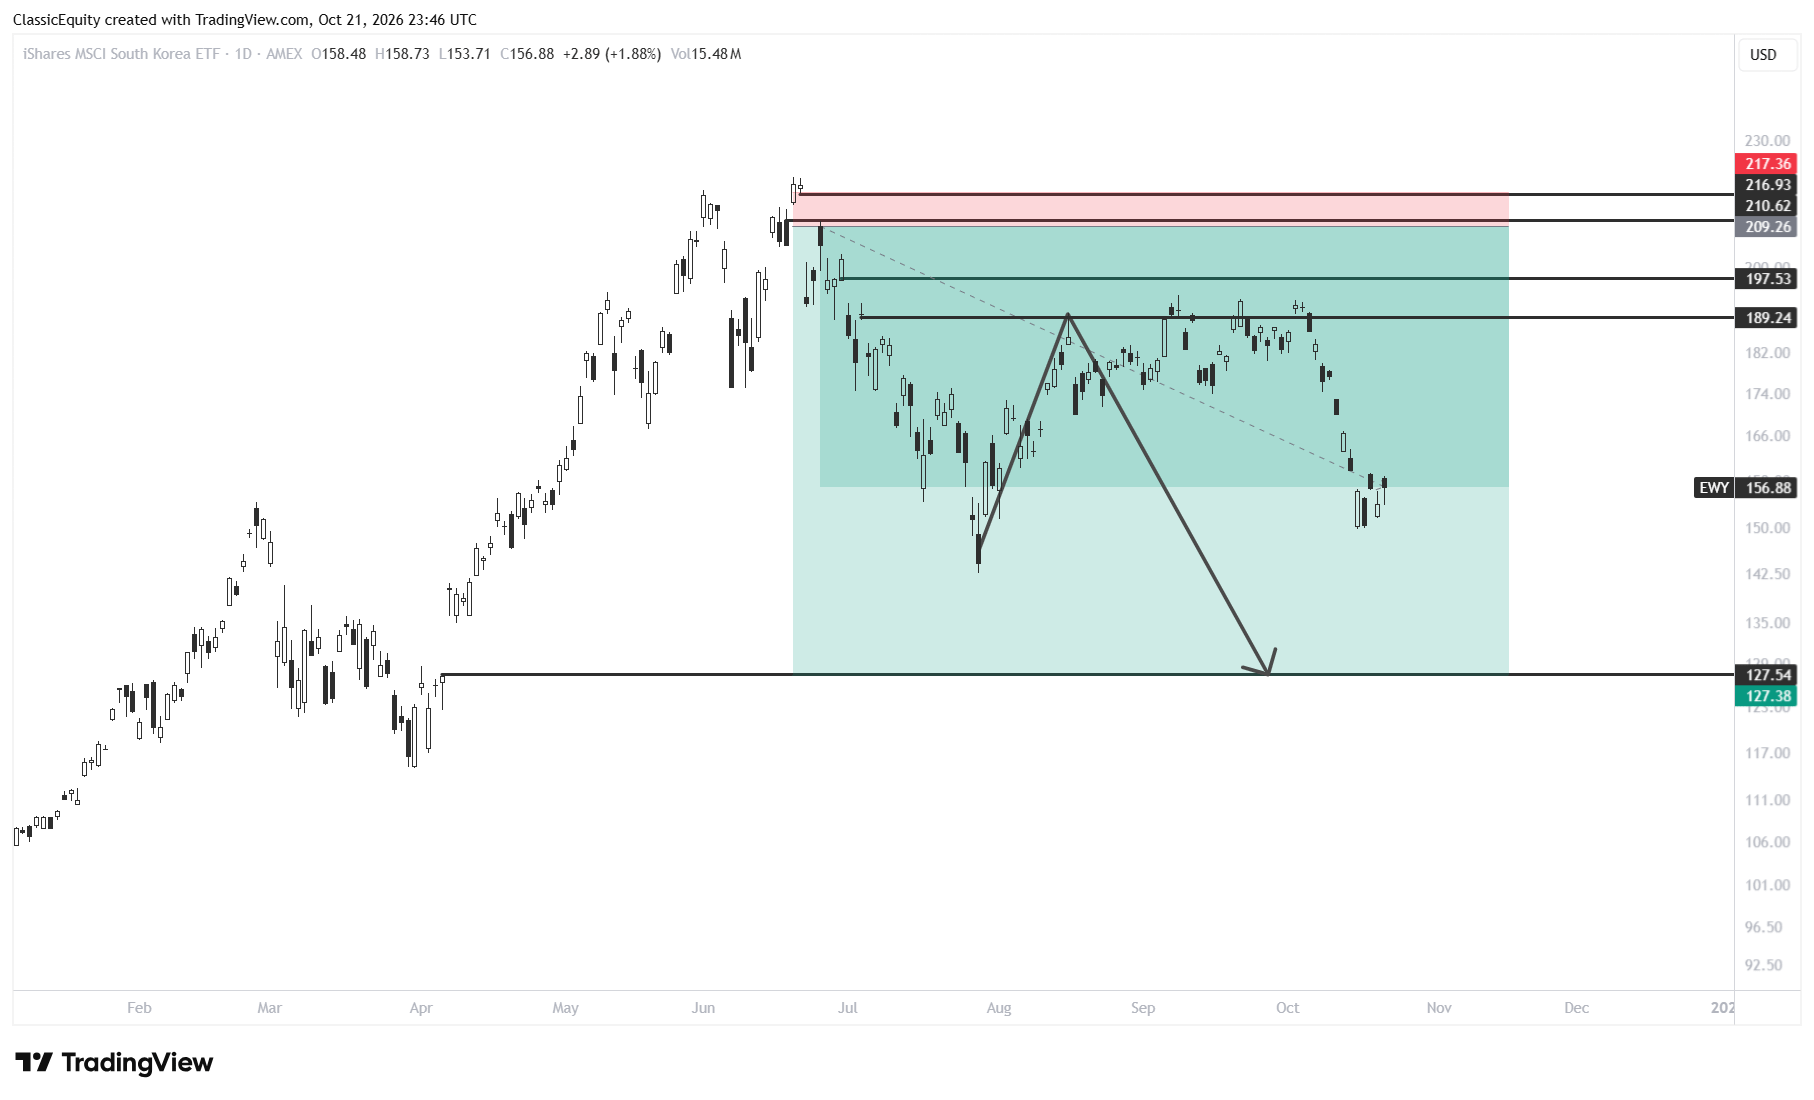
Korea
The memory trade also has the look of a potential bounce but my lean is that the top is in for this cycle
Friendly reminder, all paid subscribers now get access to the new Polycarp Research Dashboards, Trading Tools, Deep Dive Reports, and Morning Briefs, just to name a few of the offerings this platform brings to the table. At less than $30 a month, quite the steal.
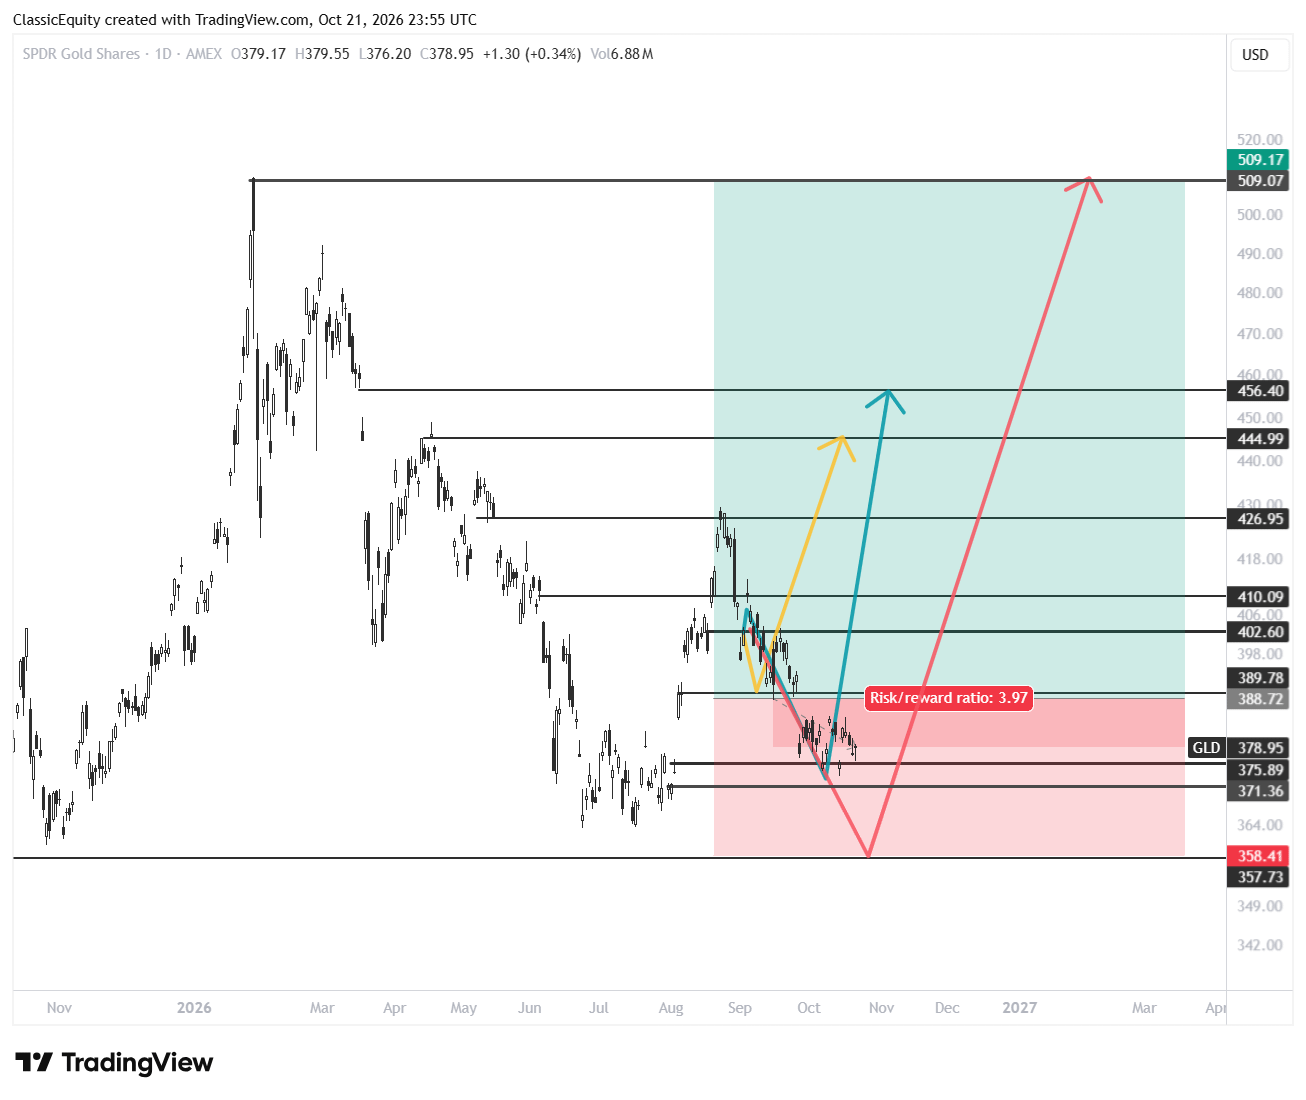
Gold
Key levels for one of my favorite long term holdings
Final Thoughts
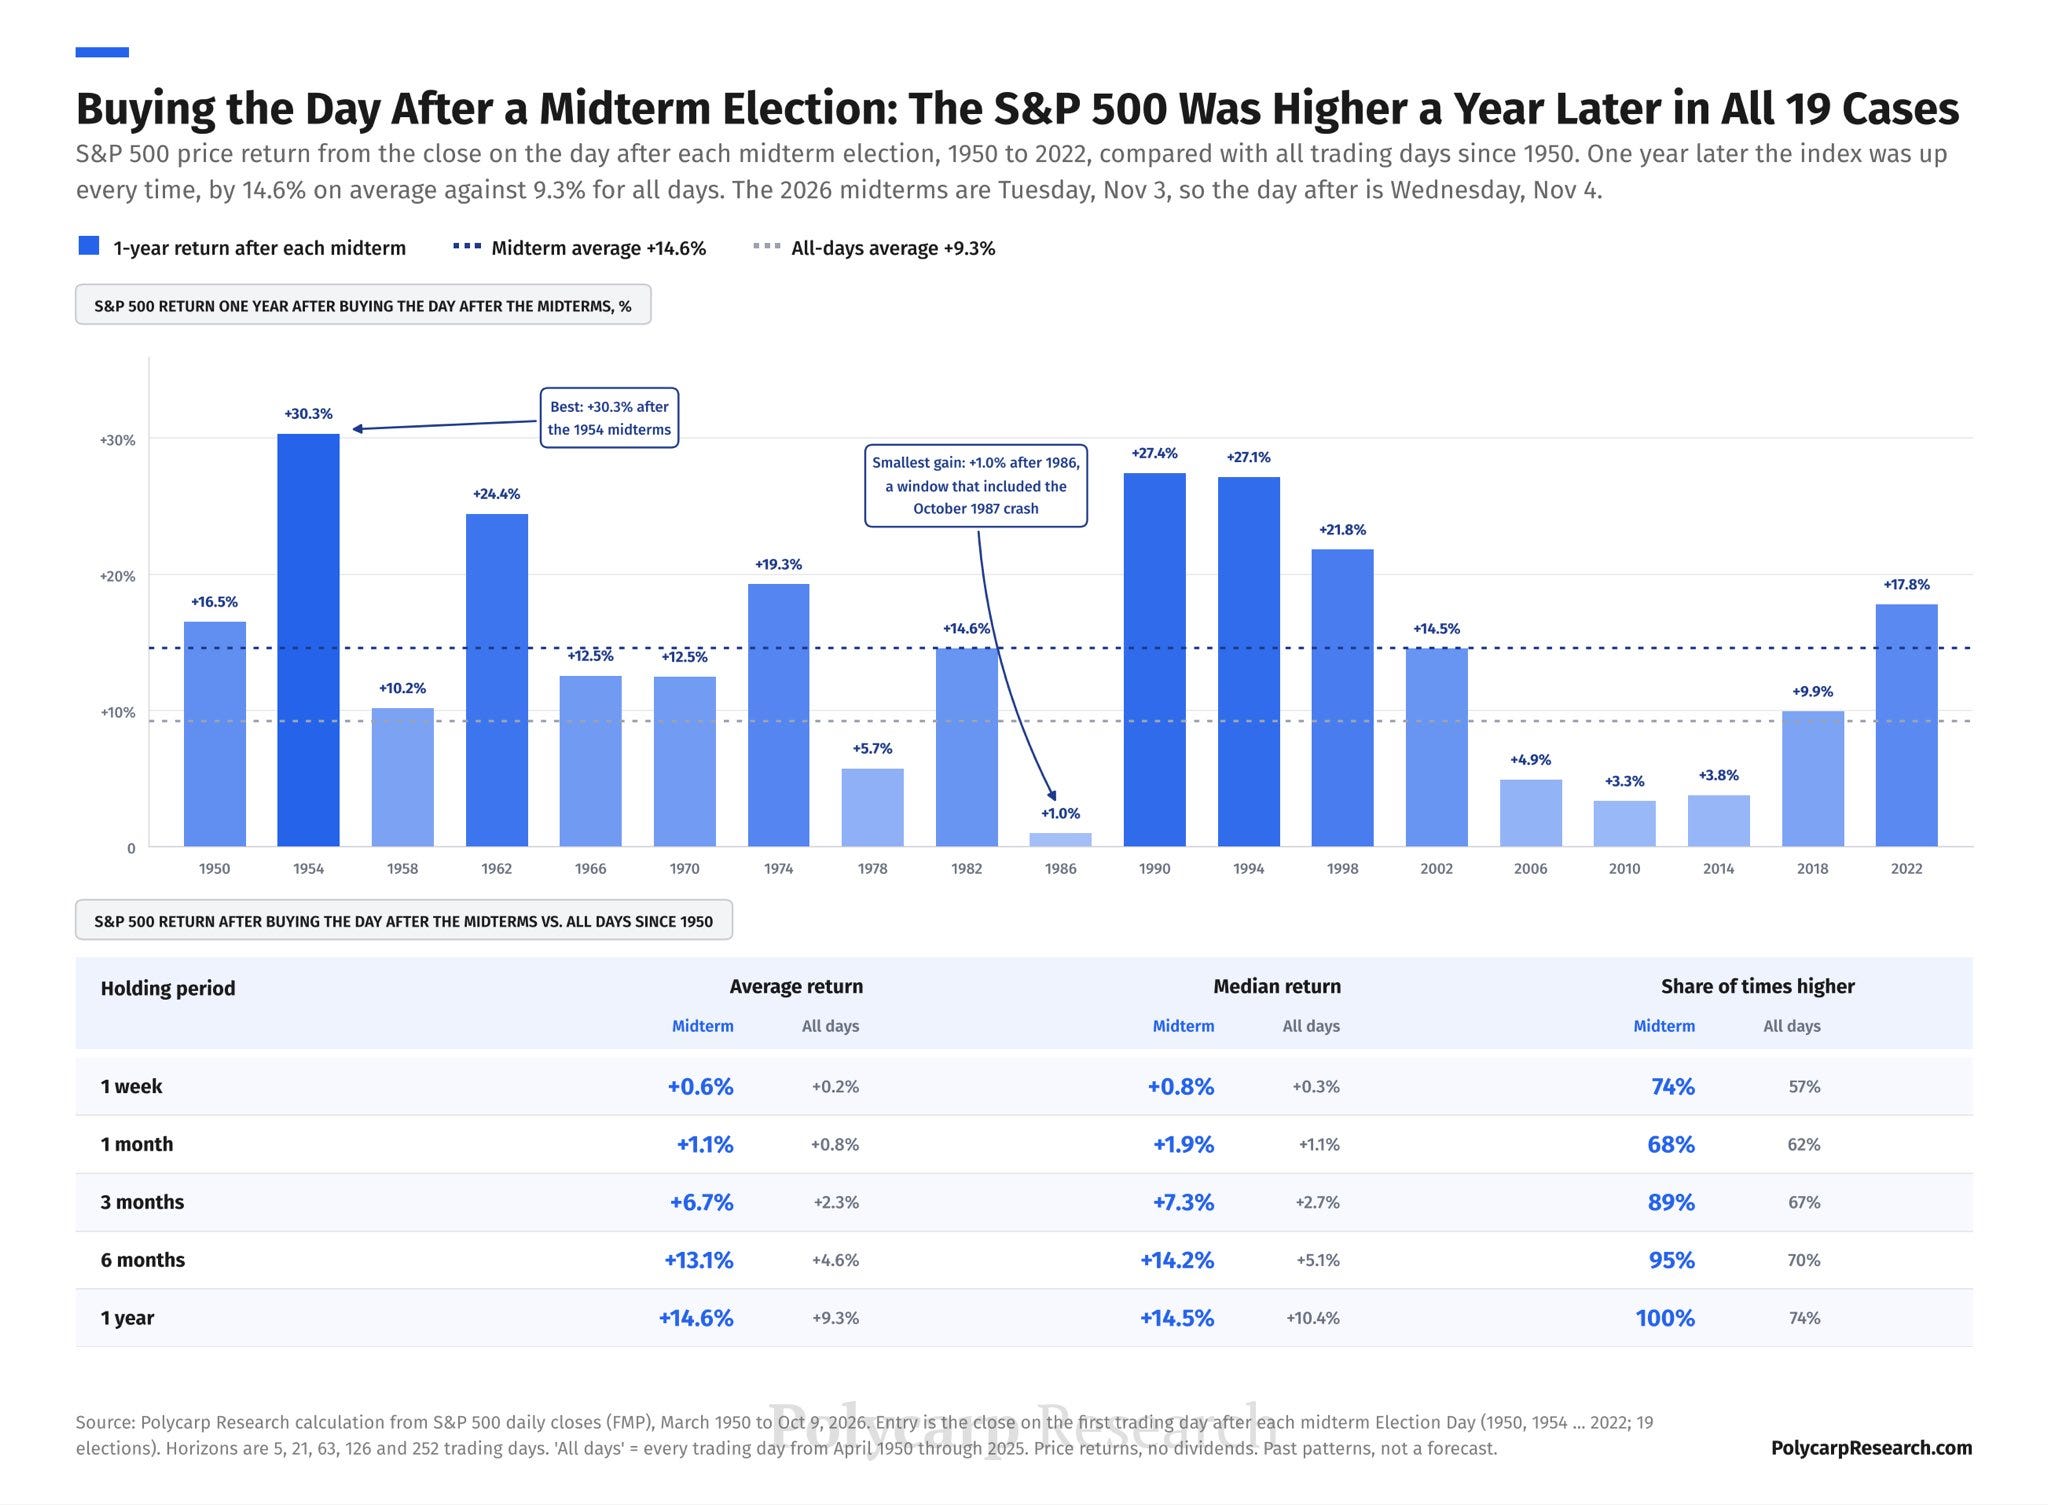
Key reminder, FOMC is next week and with it we could see some volatility. But, we are getting closer and closer to the window where the odds are highly in favor of bull historically.
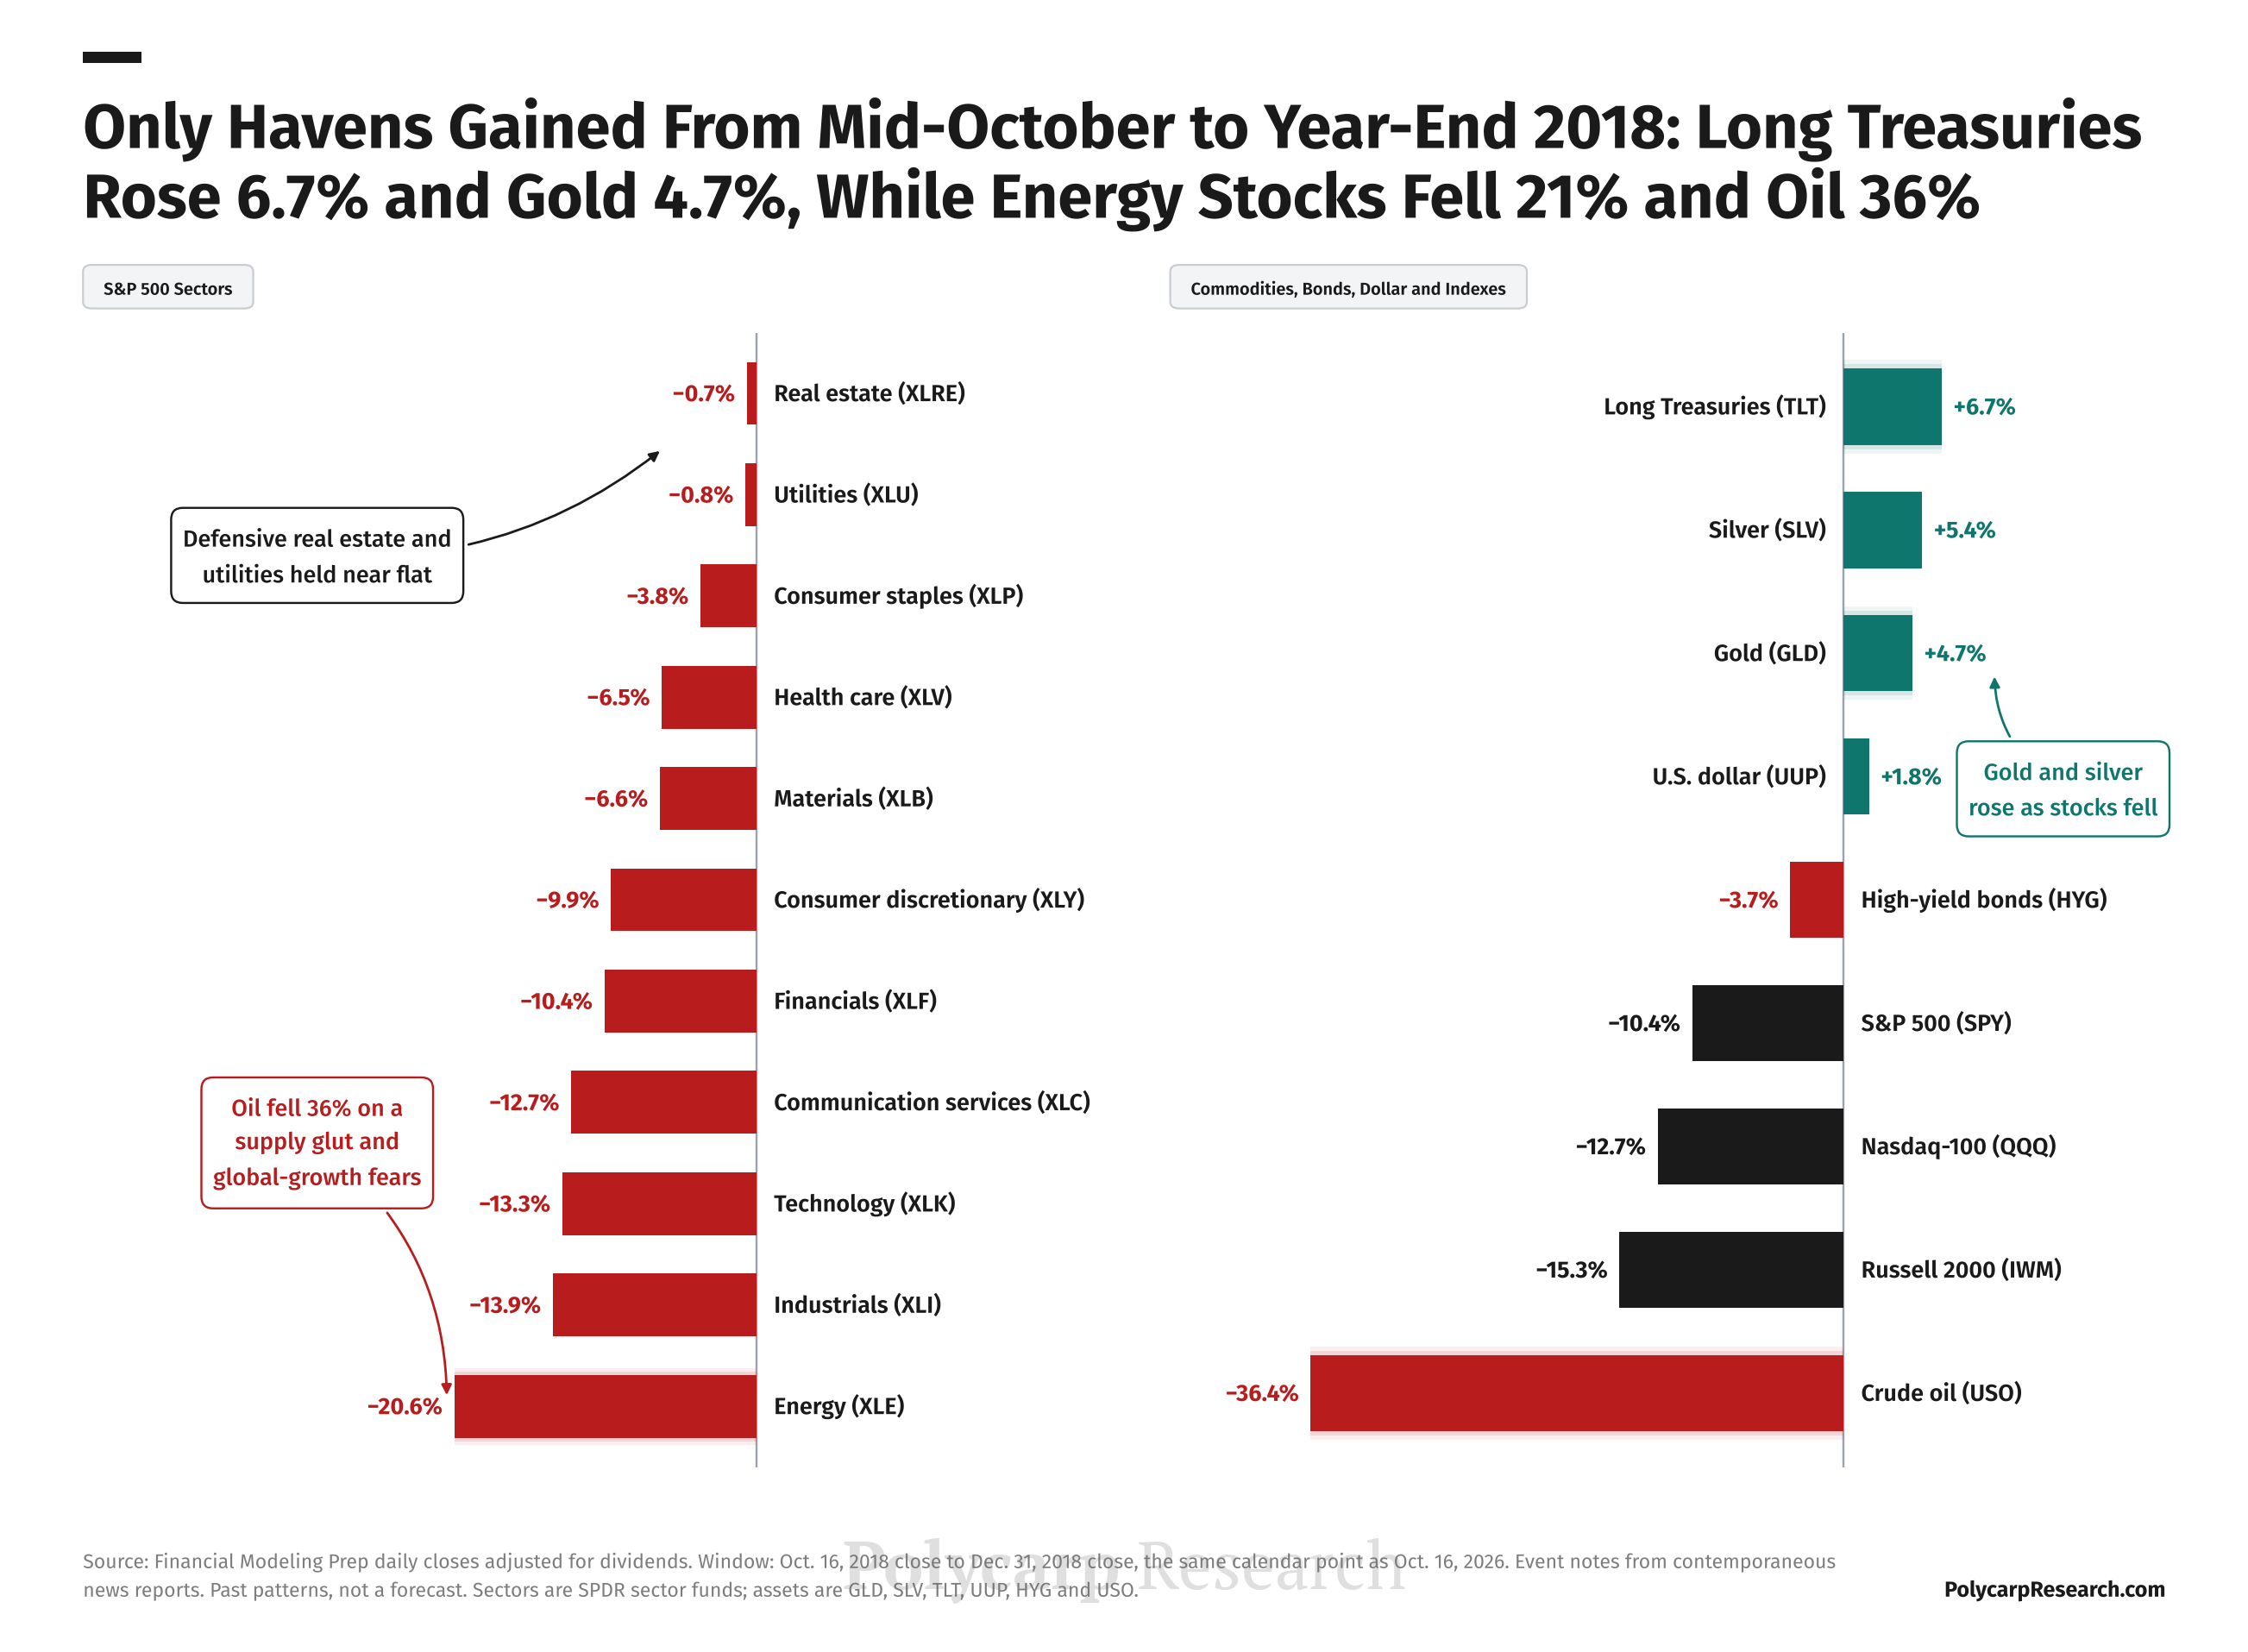
Last thing, if we do get the 2018 Analog to end the year, these were the safe havens. Cheers!