Last Week in Review
The market is being carried by a narrow set of leaders while internals are terrible — and the tape still won't break. The good news is the Dow managed to snap a 3 week losing streak on Friday and Bitcoin has come back to life of late with a surge over 80k. The bad news, yields have not cooled off and have only accelerated of late. The key question I’m asking, is the market holding up a sign of resilience or distribution?
The Resilience Case
The range has held. The S&P 500 has traded in a 4.1% range (7,508–7,817) since Aug 4 and closed at 7,743, 0.7% below its Aug 13 record.
It absorbed bad news. The range held through the Fed’s rate hike to 3.75–4.00% and a 10-year Treasury yield near 5.2%.
Dips get bought. The index is up 2.5% in seven sessions since the Sep 16 low.
Semiconductors are leading
No sign of fear. VIX is at 14.9 and never went above 18 during the range.
The Distribution Case
Heavy-volume selling. There were 5 distribution days in the last 25 sessions, all between Aug 31 and Sep 16. A distribution day here is an S&P 500 drop of at least 0.2% on higher volume than the day before.
Most stocks are falling. Since the record, the equal-weight S&P 500 is down 5.2% and small caps are down 7.1%.
Weak breadth. Only 27% of S&P 500 members are above their 50-day average.
Credit is softening. The high-yield bond ETF (HYG) is down 2.4% in price.The traditional read is that credit is warning and equities haven't caught up yet. On a 1–2 week window, though, the signal is noisy, and in today's market much of HYG's drop is rates rather than credit
So what to do with all this information? Where can I find an edge? Well here’s the thing, the details are what matters when it comes to things like flow, positioning, and seasonality. Often we get to general when we need to dive just a little deeper. When reviewing seasonality beyond the front level what can we find?
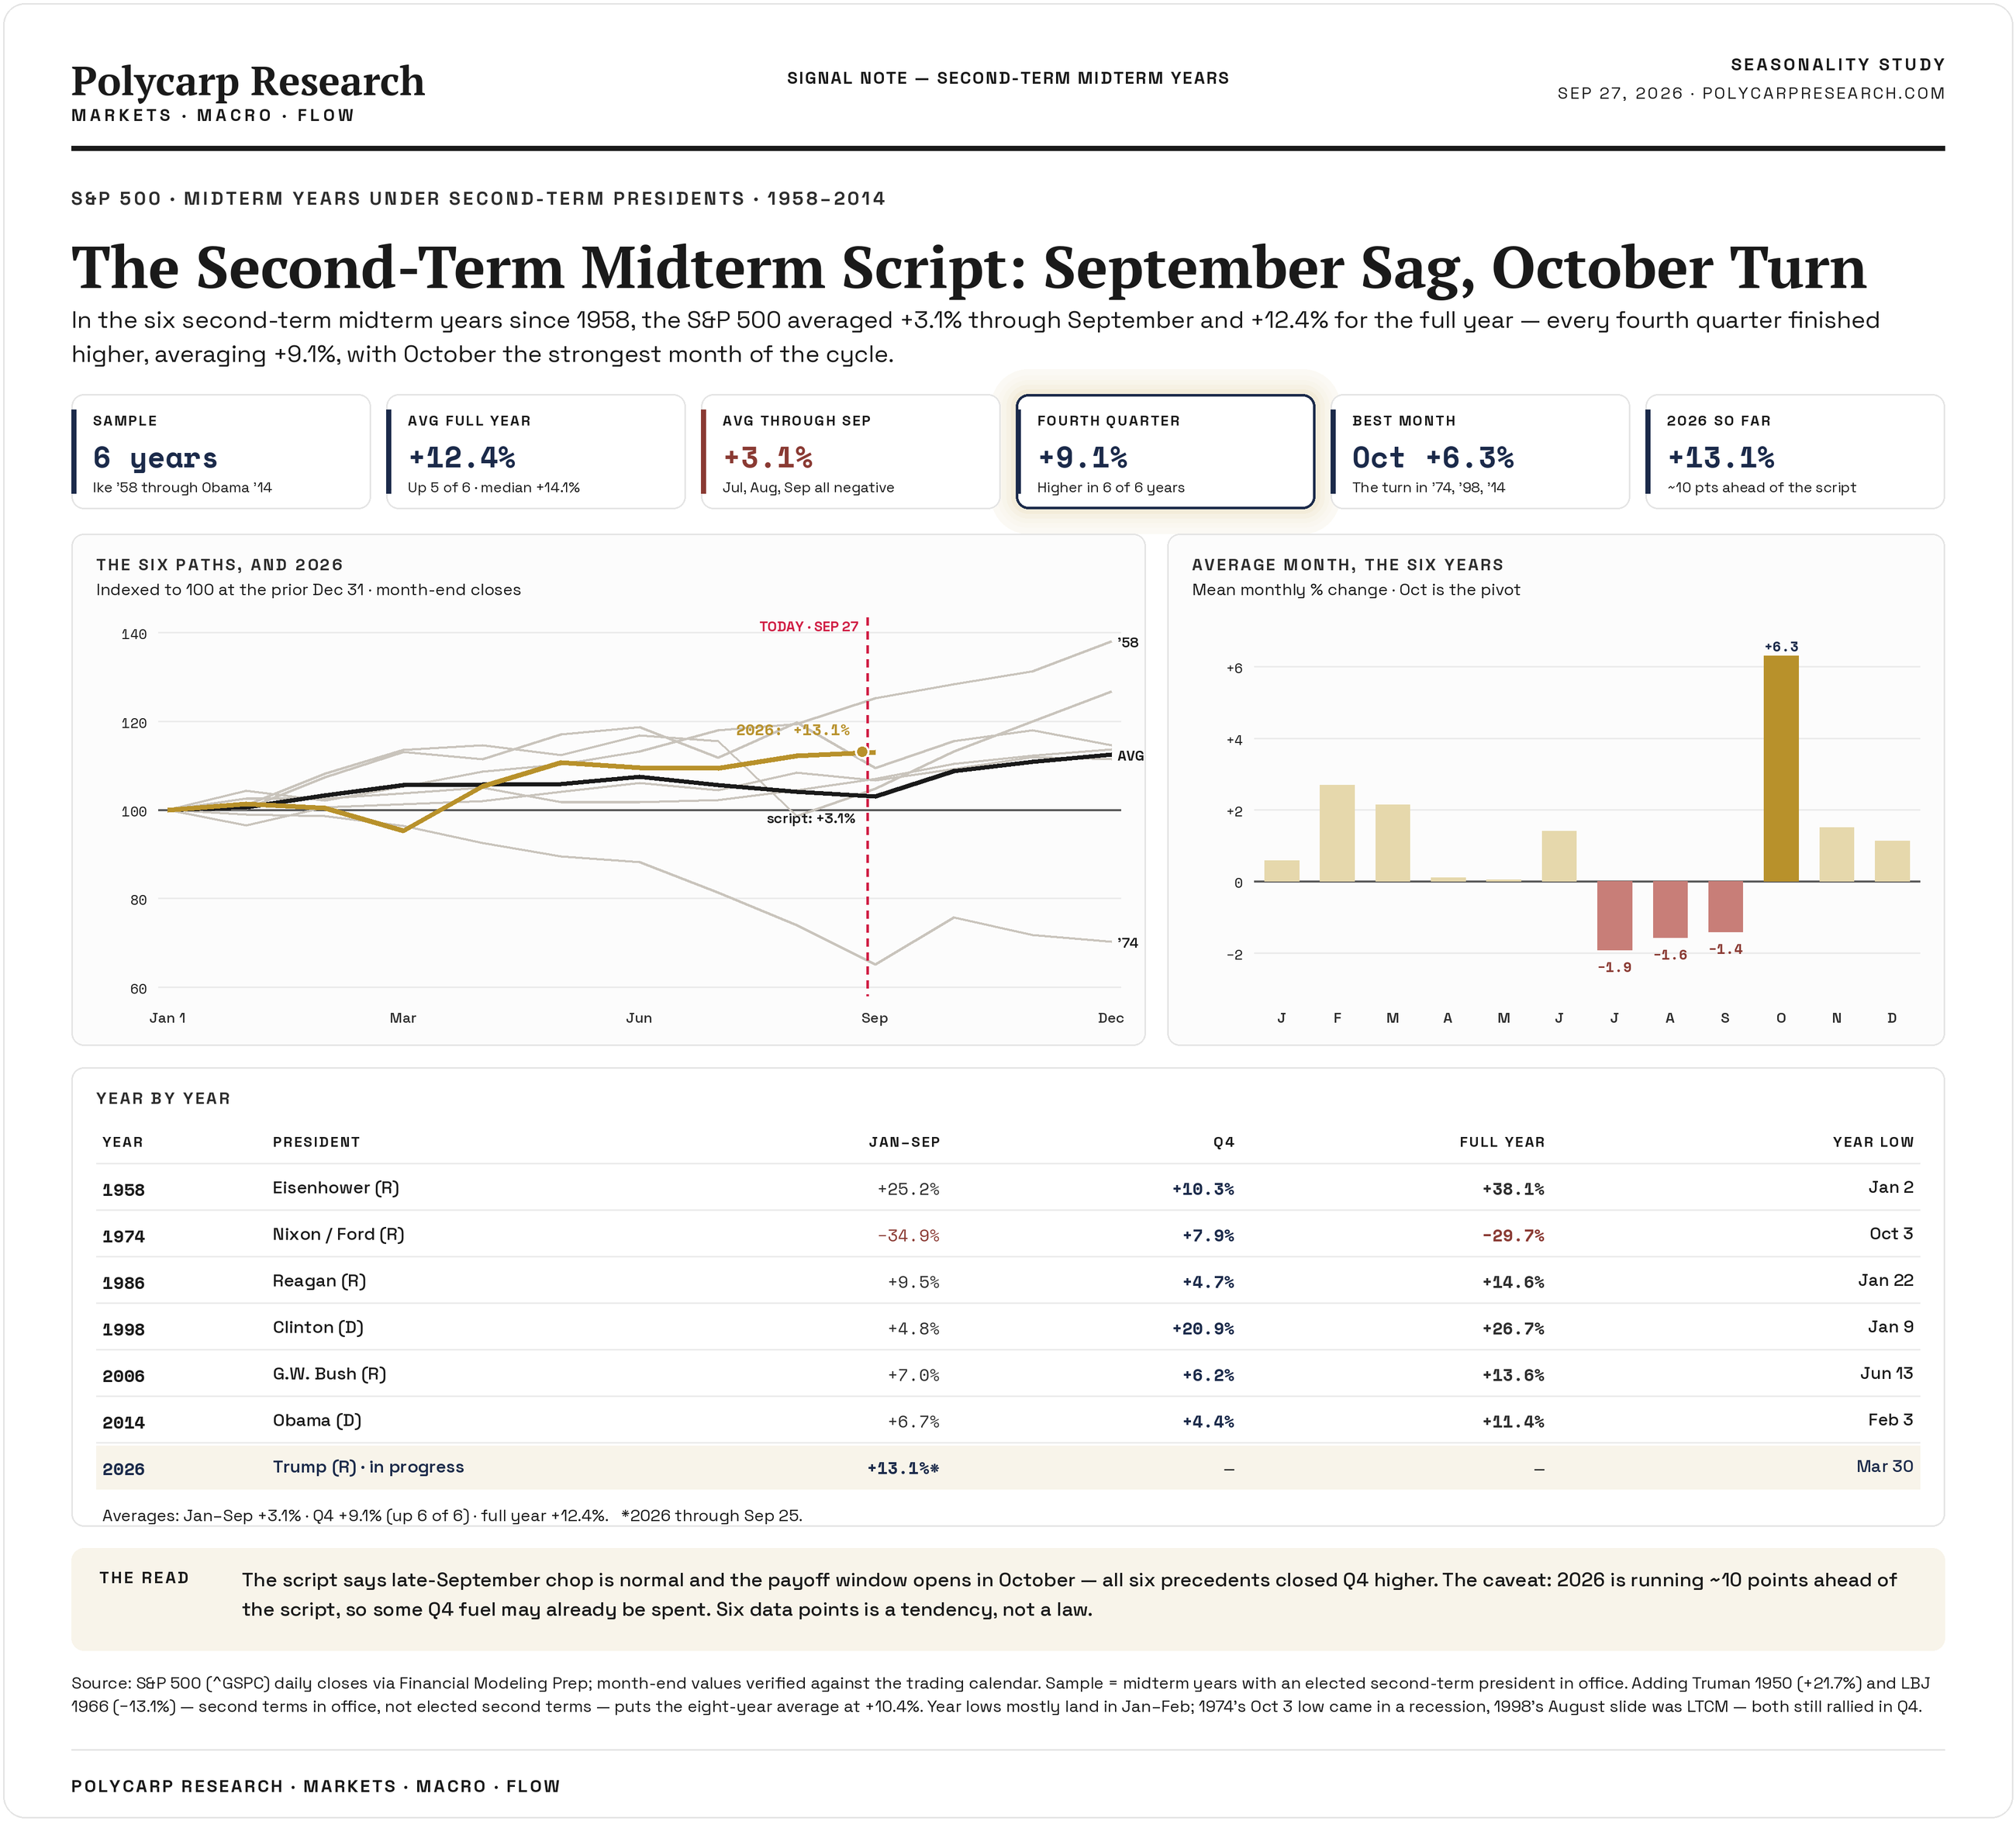
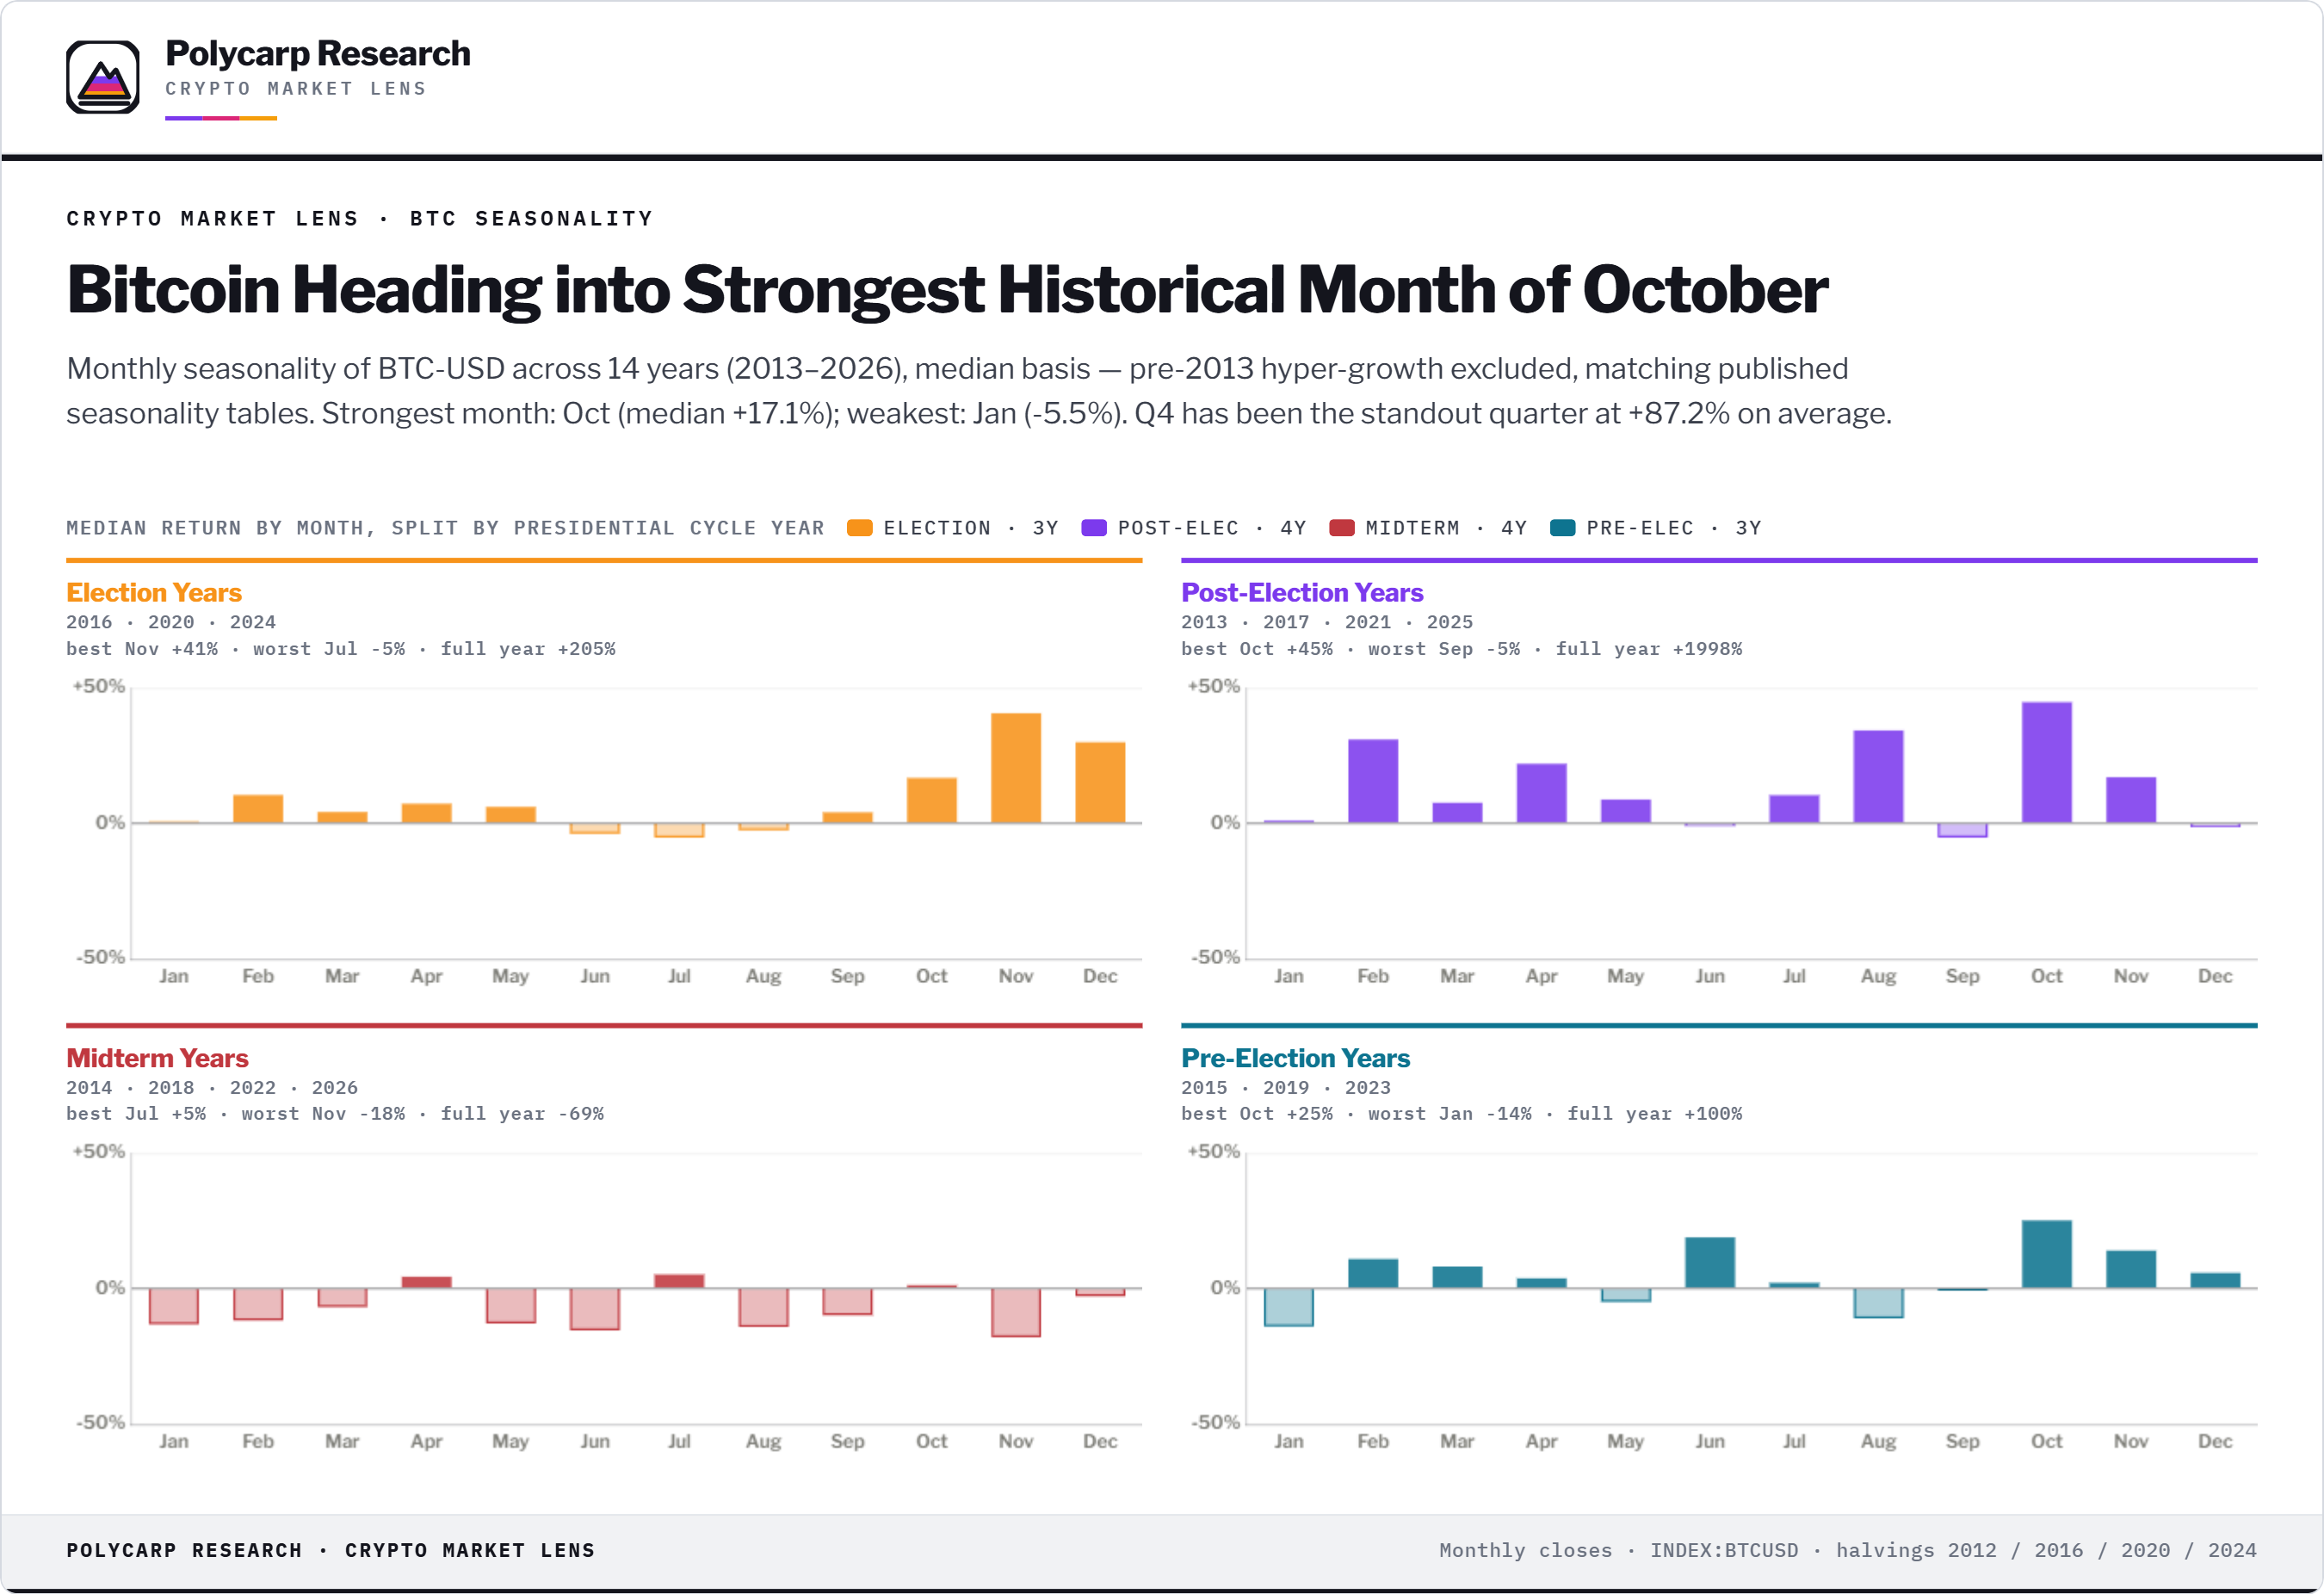
2nd Term Presidents, during a Mid Term Year, what does it tell us about what may come next? Well, it shows a 100% hit rate for Q4 at +9% and October being the strongest month of the cycle by a large margin.
Just one data point, but a good one to keep in mind.
Evidence-led financial research combining macro, technicals, and flow to create an edge in every market environment
Join our premium subscribers with this special offer
Current Picture
That 300-handle box (7500–7800) is the entire September distribution. Call resistance at 7800 = where upside gamma / profit-taking lives. Put support at 7500 = where downside hedges sit and where dip-buyers have already shown up once.
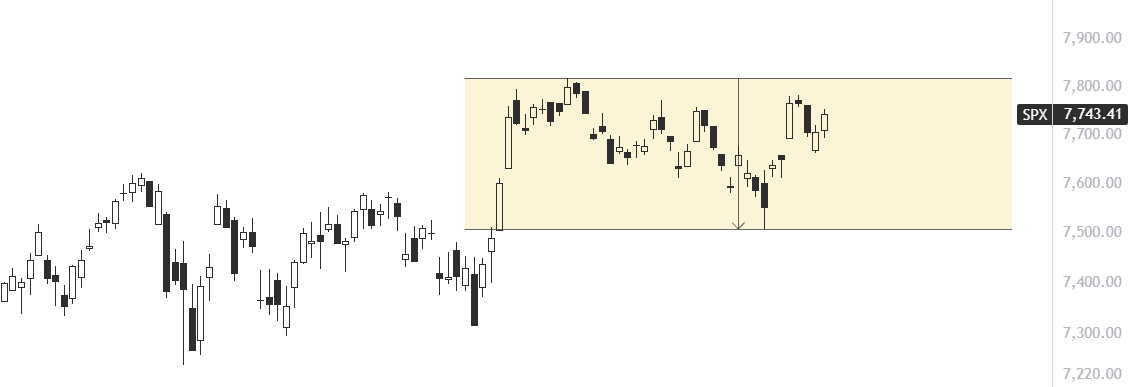
My current lean, be patient and play the ranges for now. Let the market and price dictate while in this range, there are plenty of setups across the board vs trying to figure out the next index move here. As you will see in the seasonality portion of the paper and in the 2nd Term president read I already shared, we are very close to a setup worth waiting for.
Economic Calendar
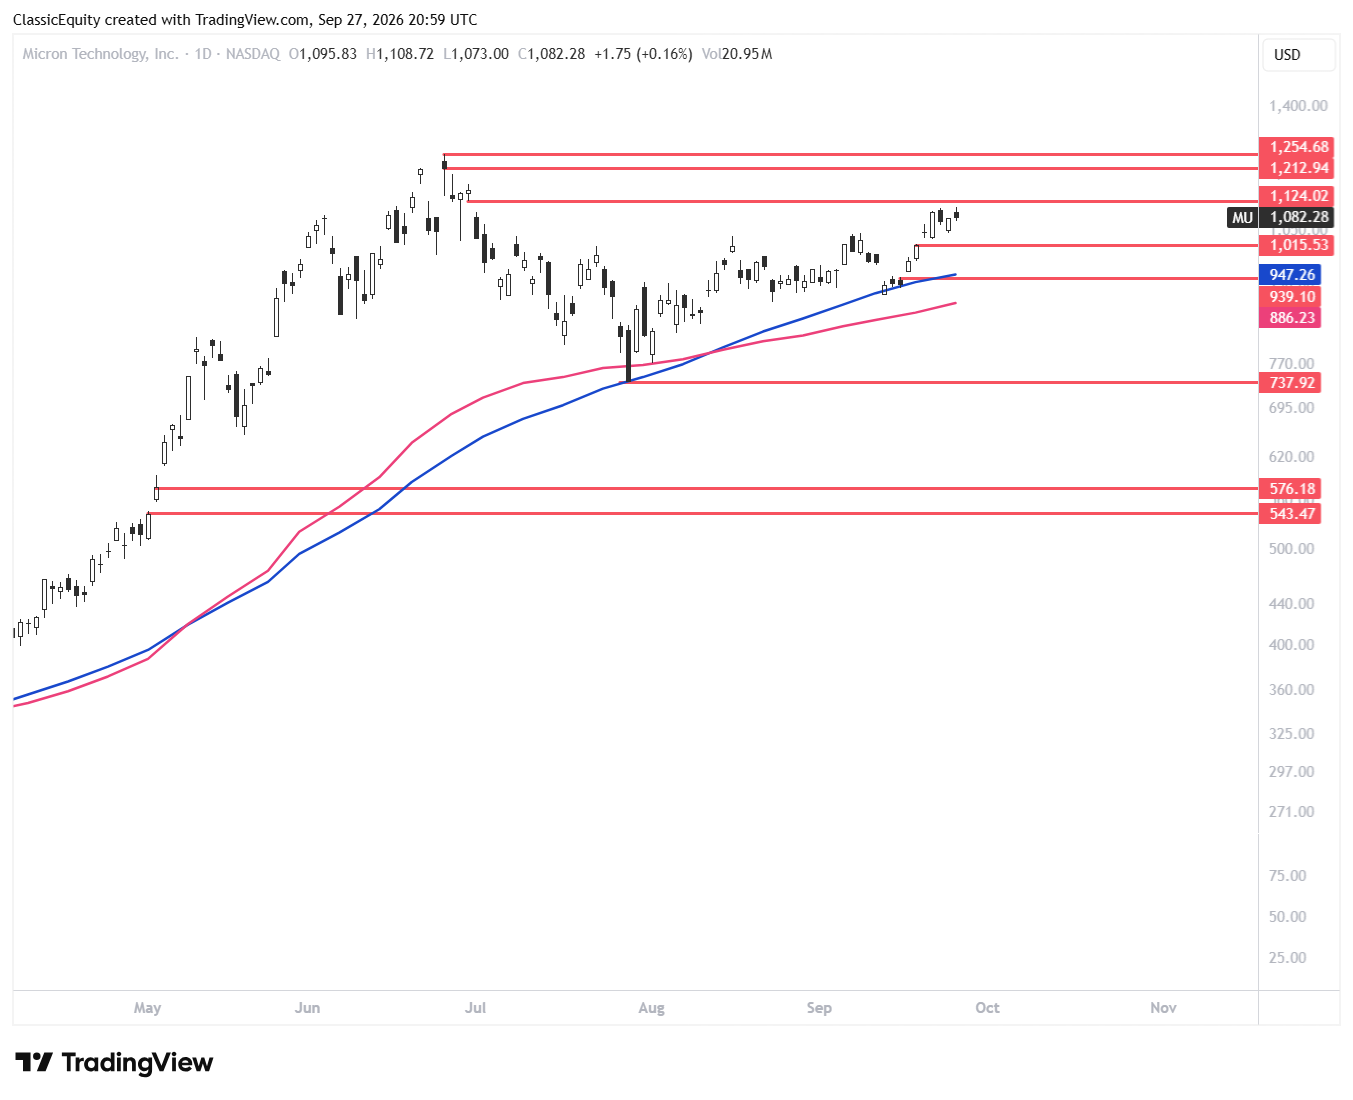
Want to keep an eye on Wednesday with PCE and MU earnings being key potential catalyst
Monday: Post Weekend Iran News
Tuesday: JOLTS
Wednesday: PCE (Inflation, potential key catalyst), MU Earnings in the afternoon
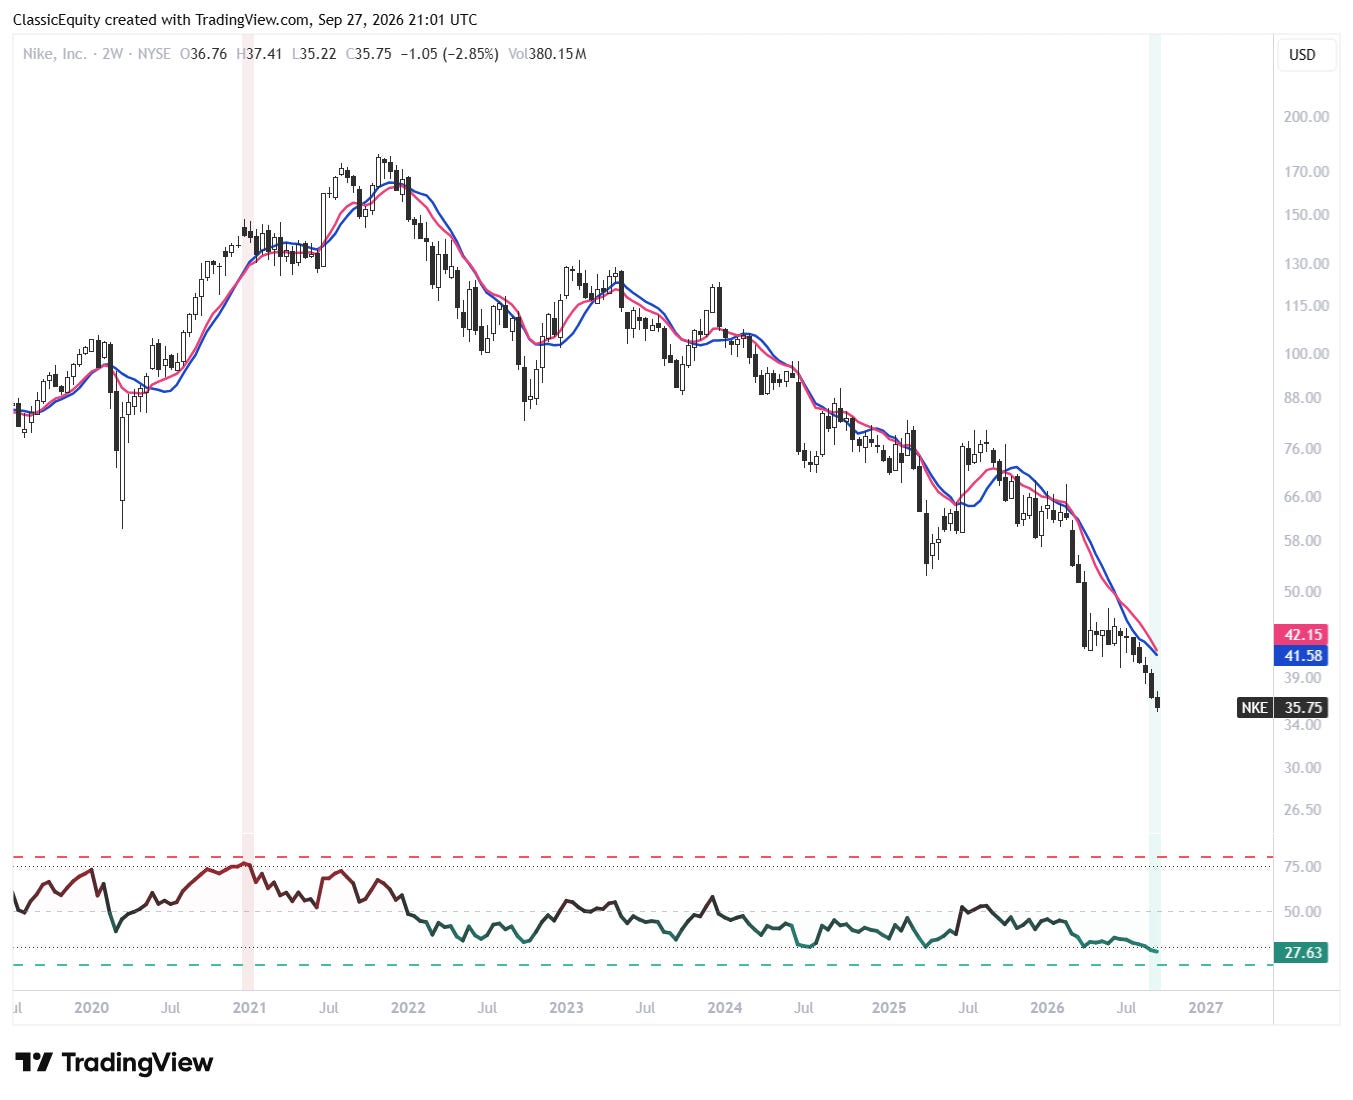
Thursday: NKE Earnings
Friday: September Payrolls, ISM Manufacturing
Seasonality Roadmap
Short Term
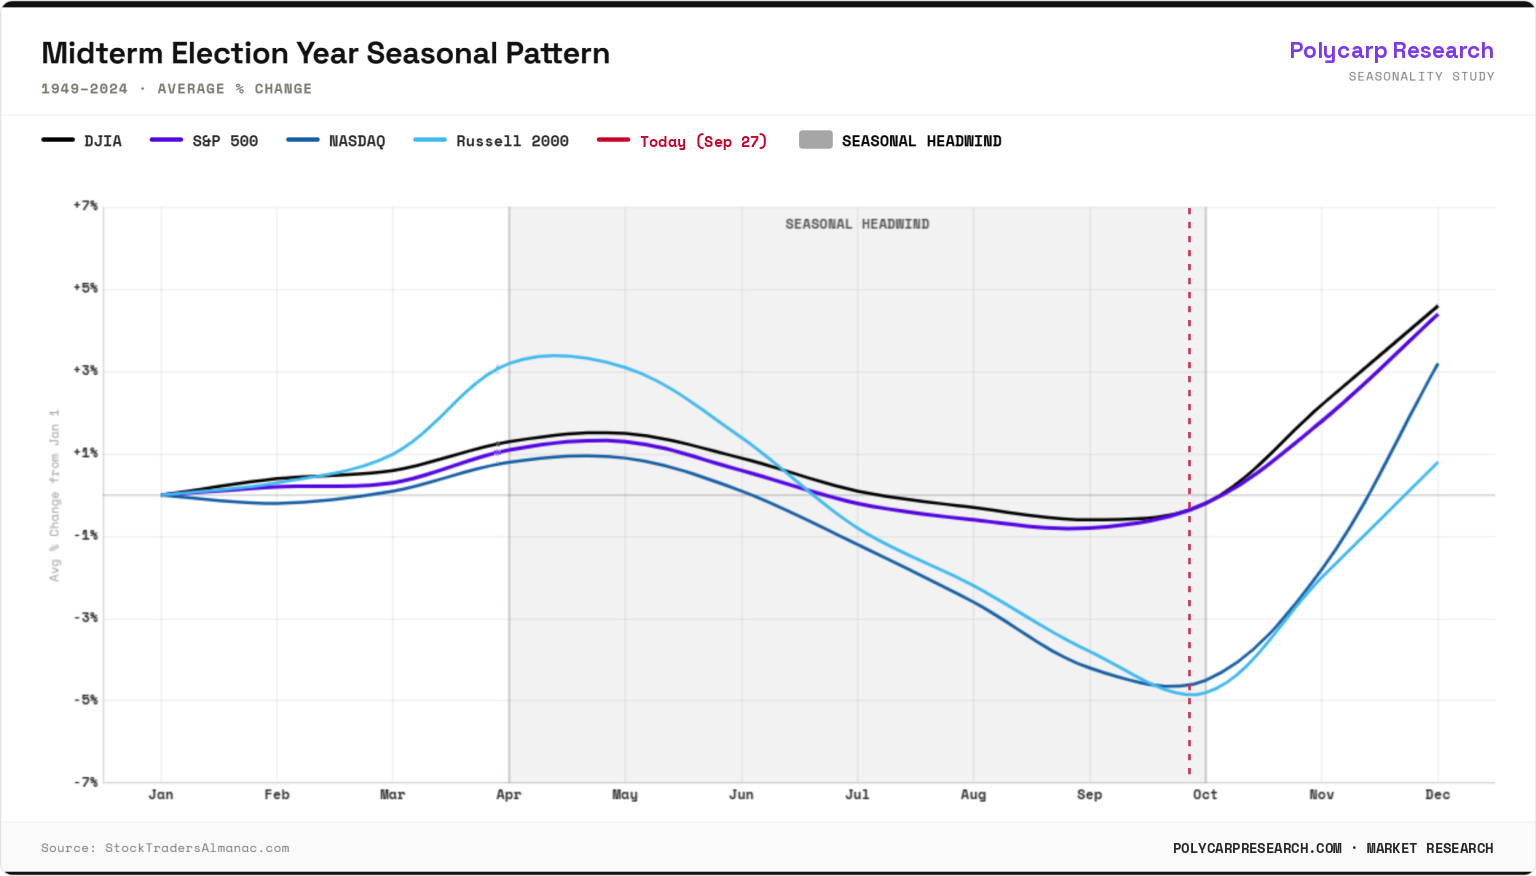
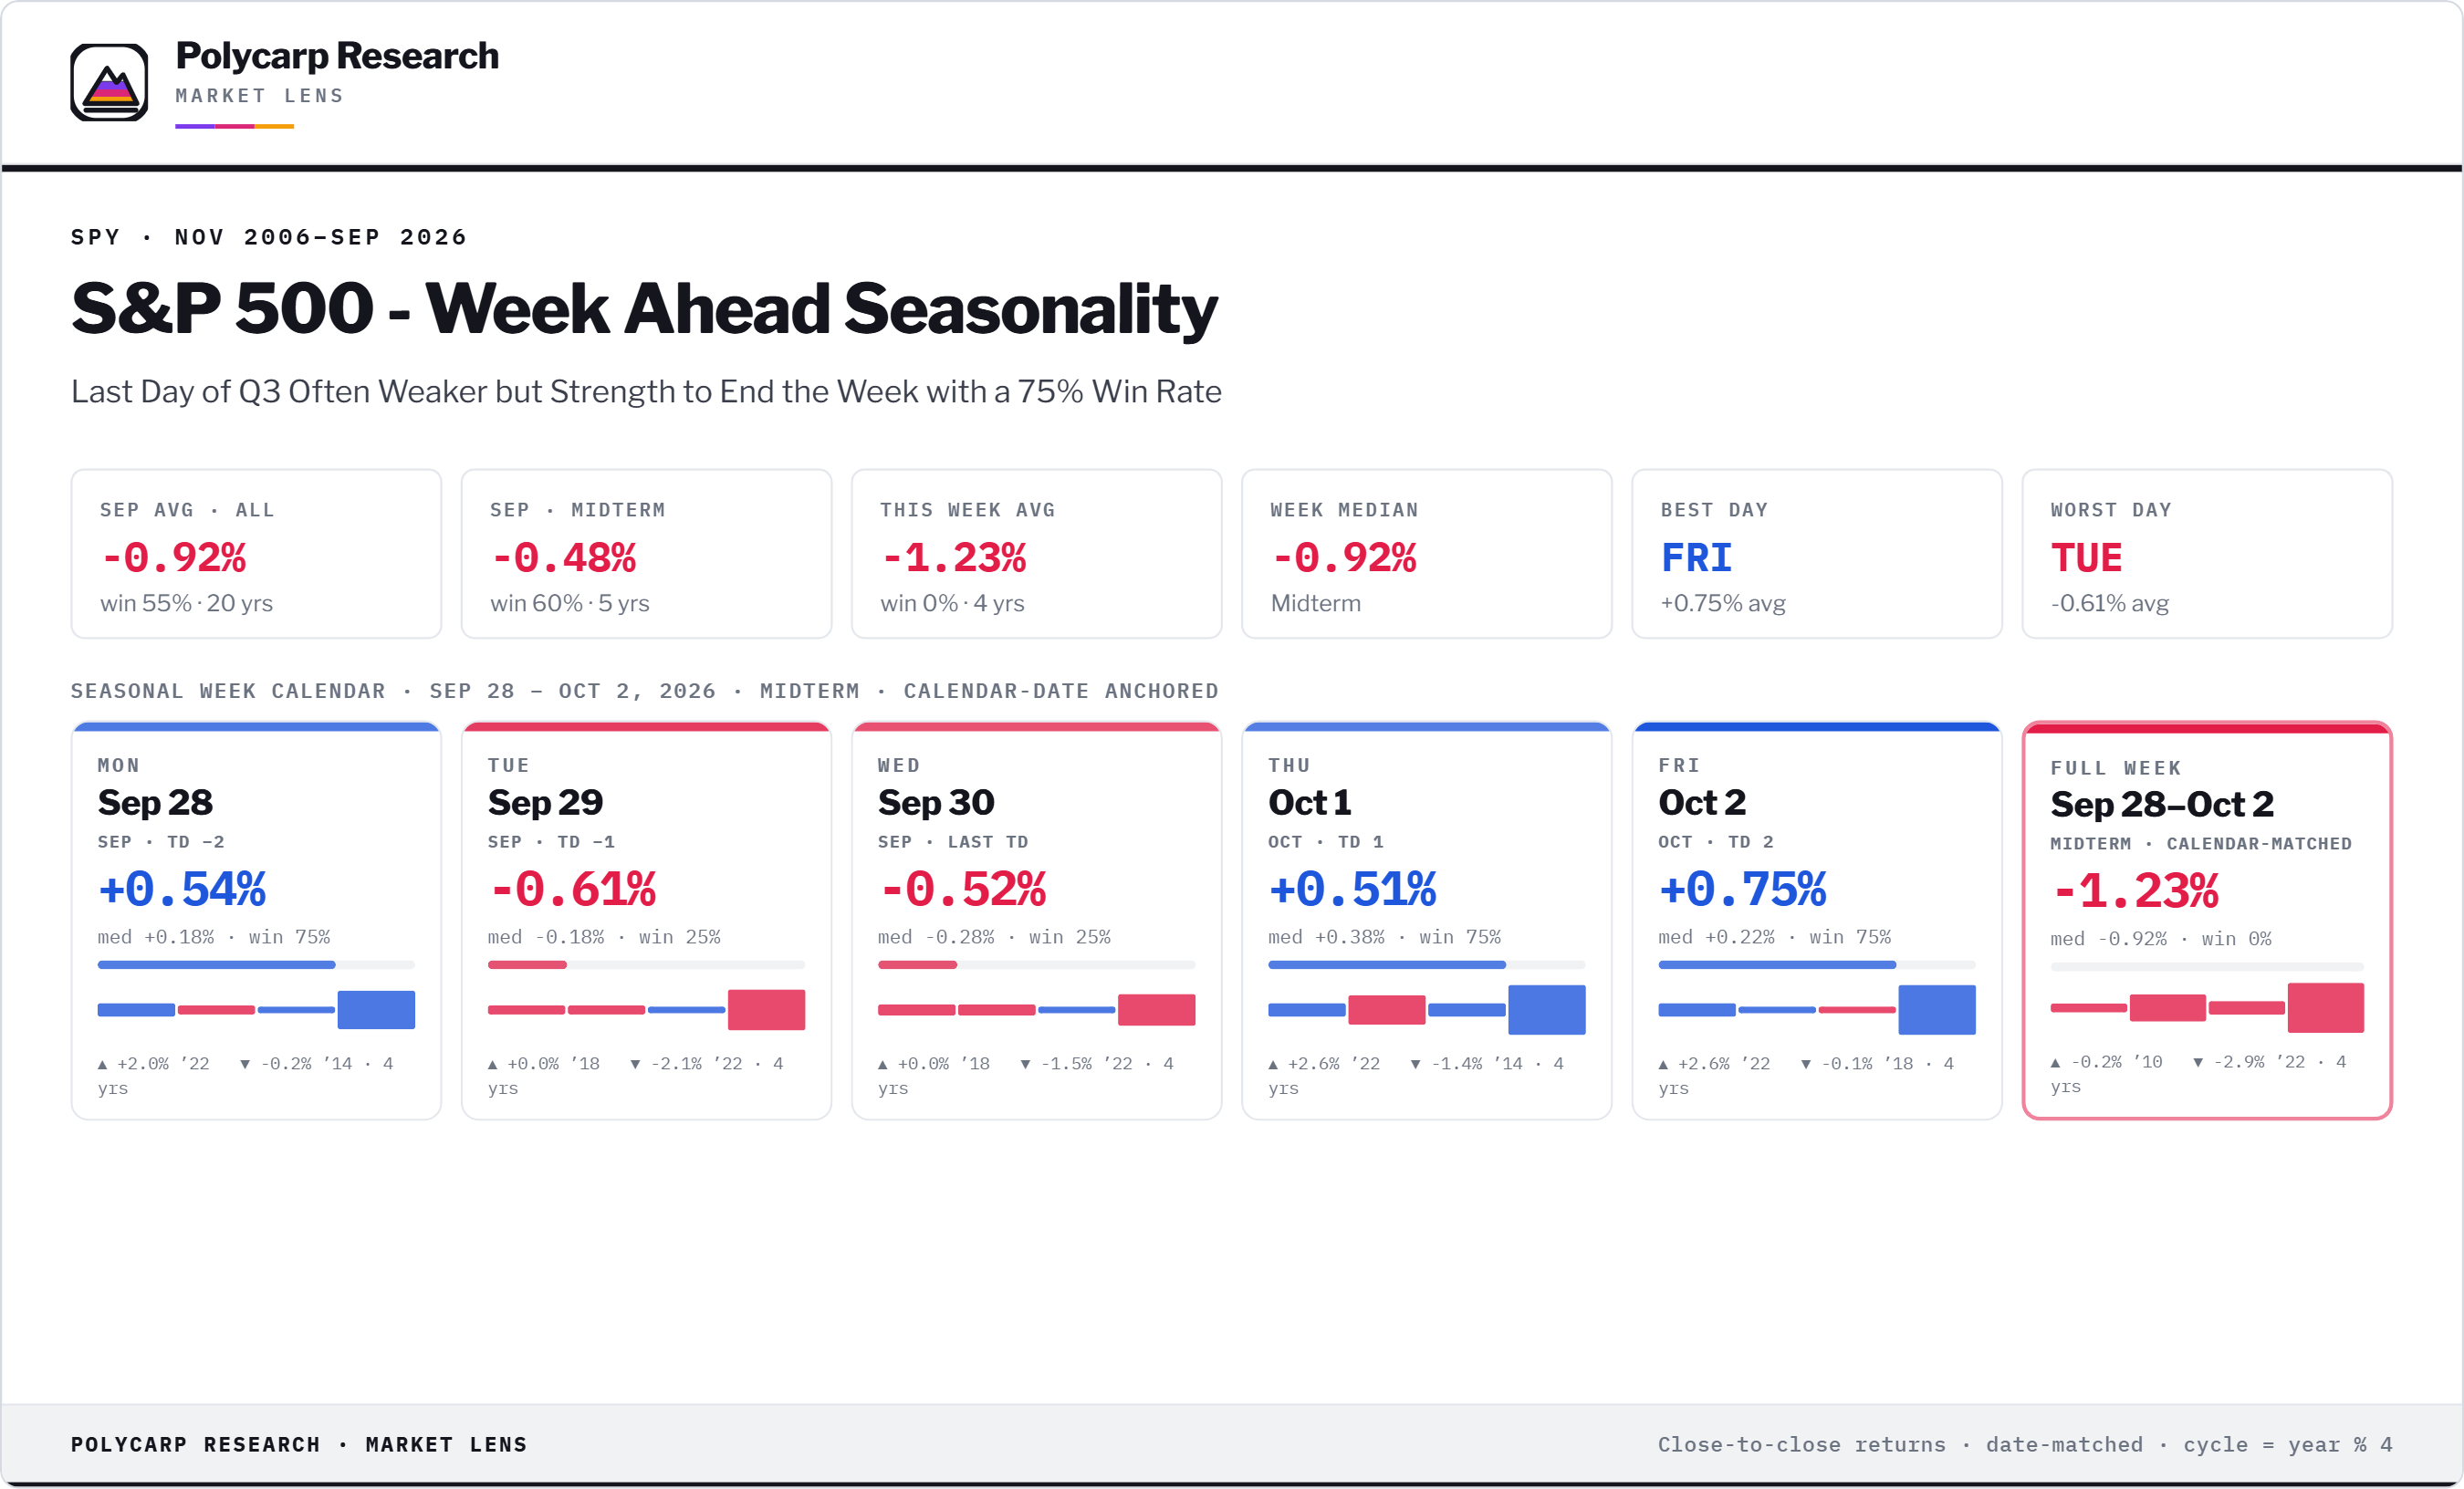
The last week of September often has some weakness early and strength Oct 1st and 2nd.
Medium Term
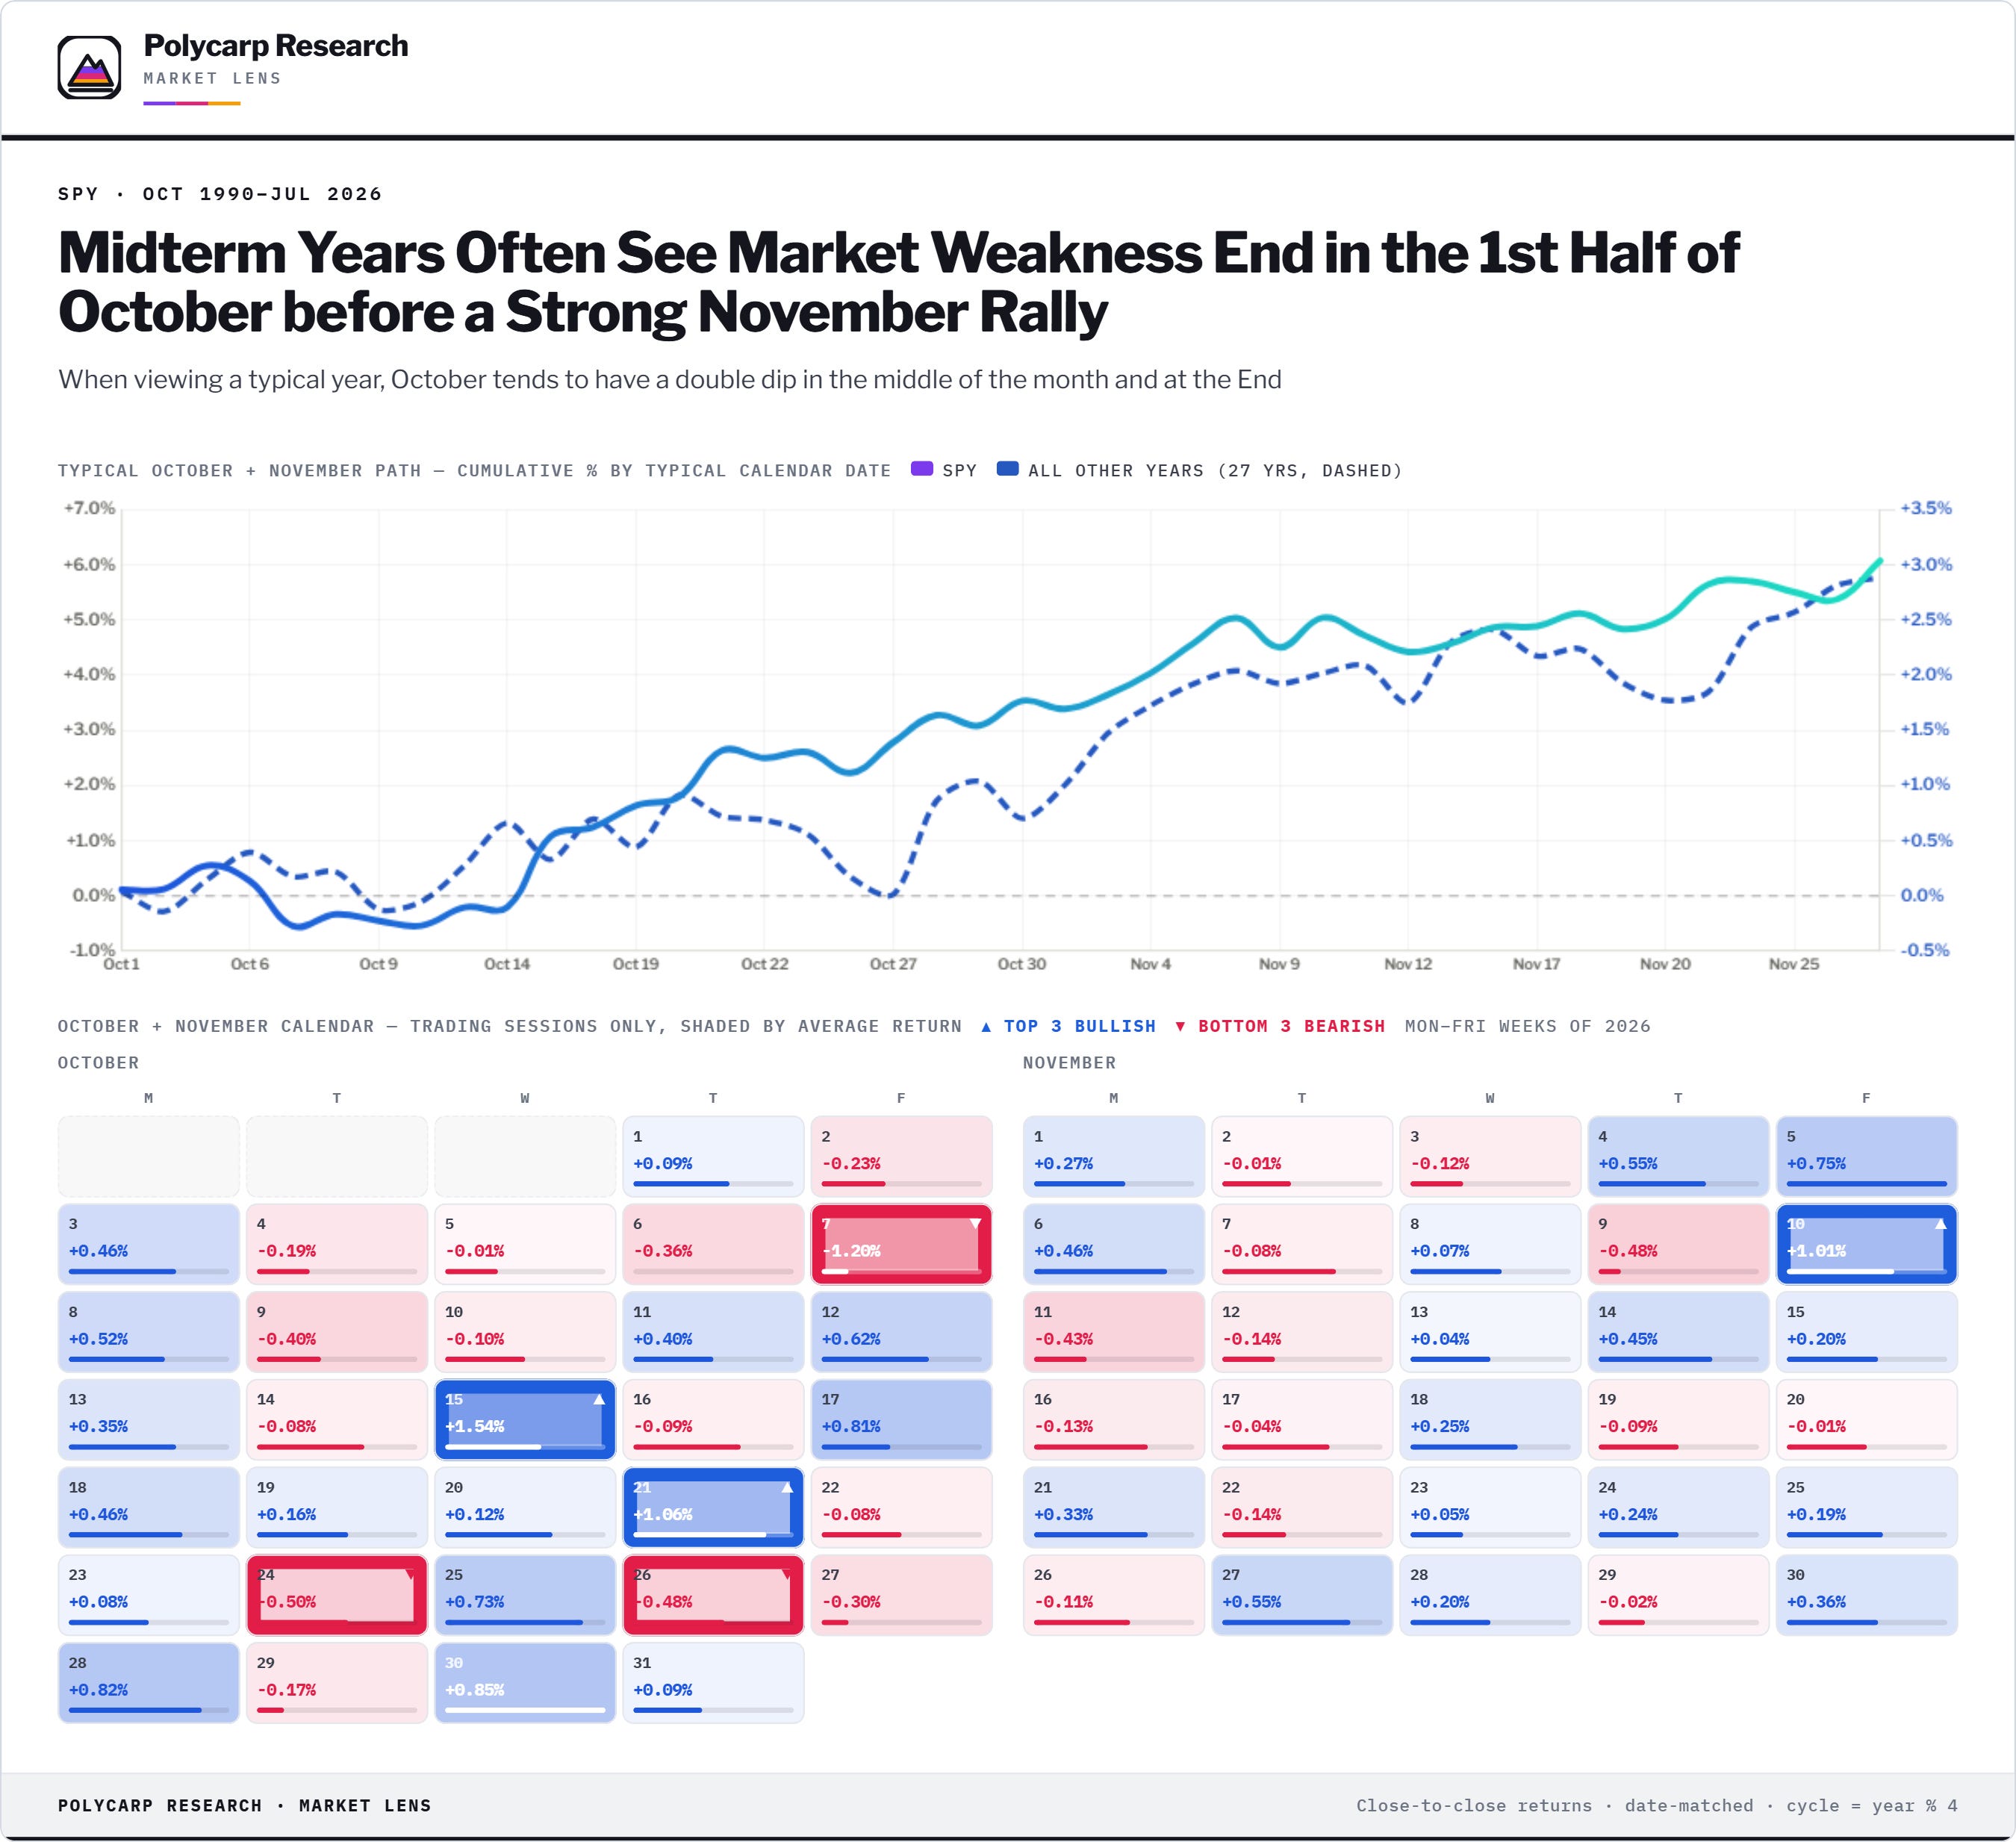
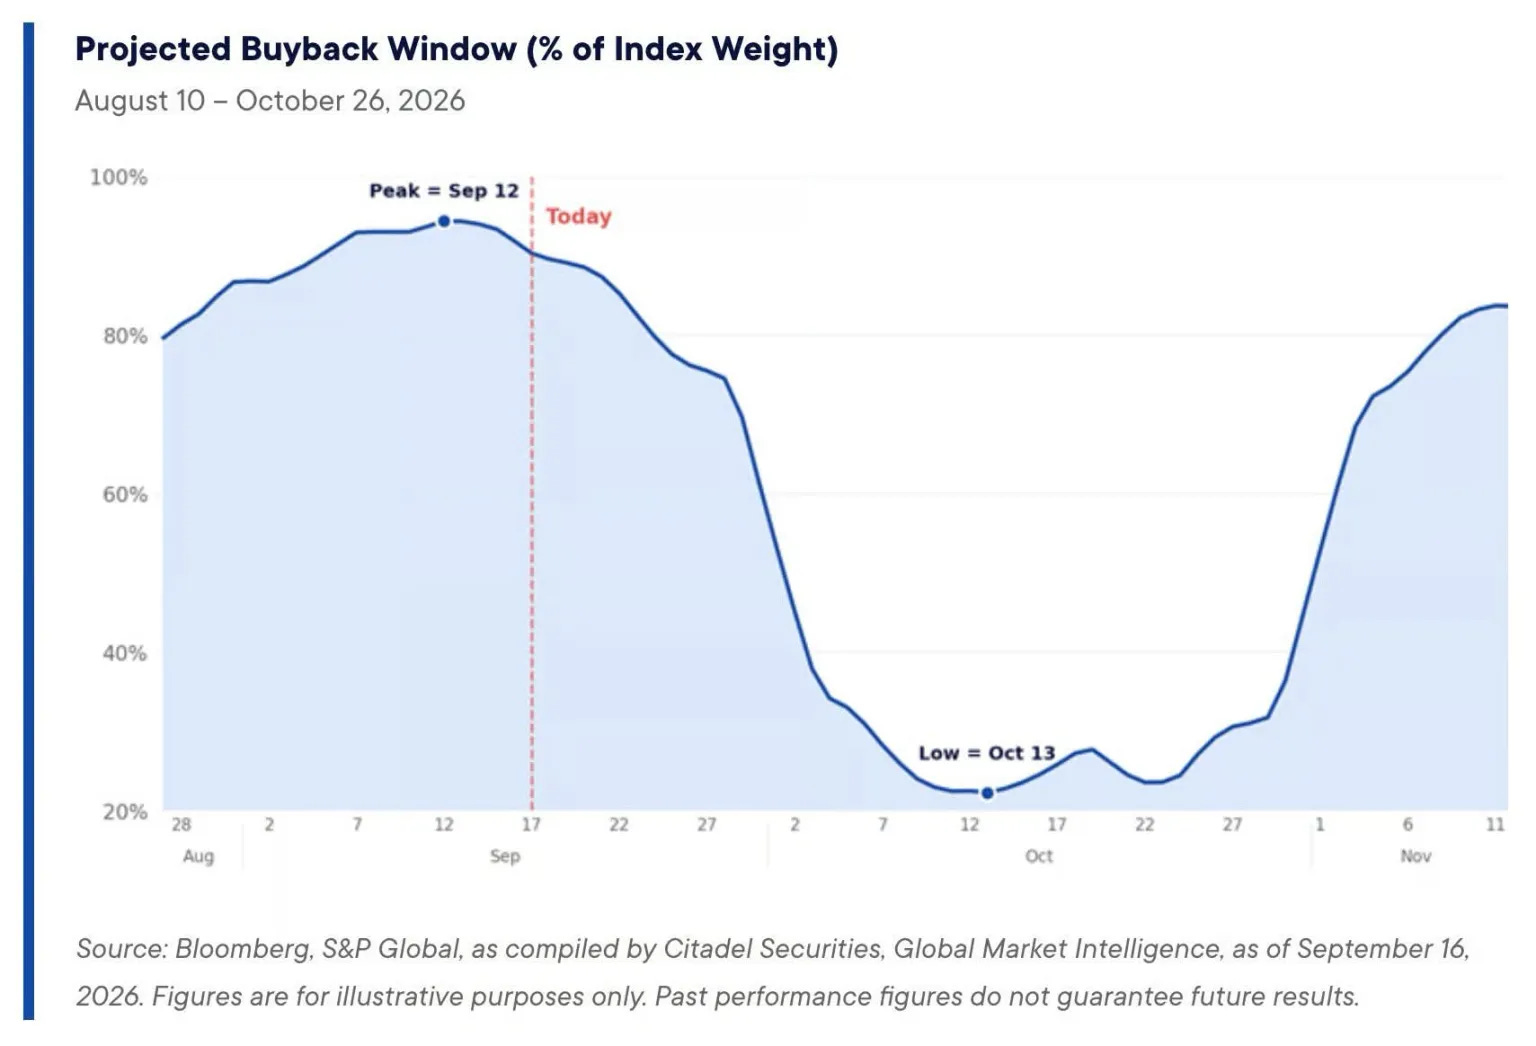
Market often weaker in the 1st half of October before a strong rally into November
Longer Term
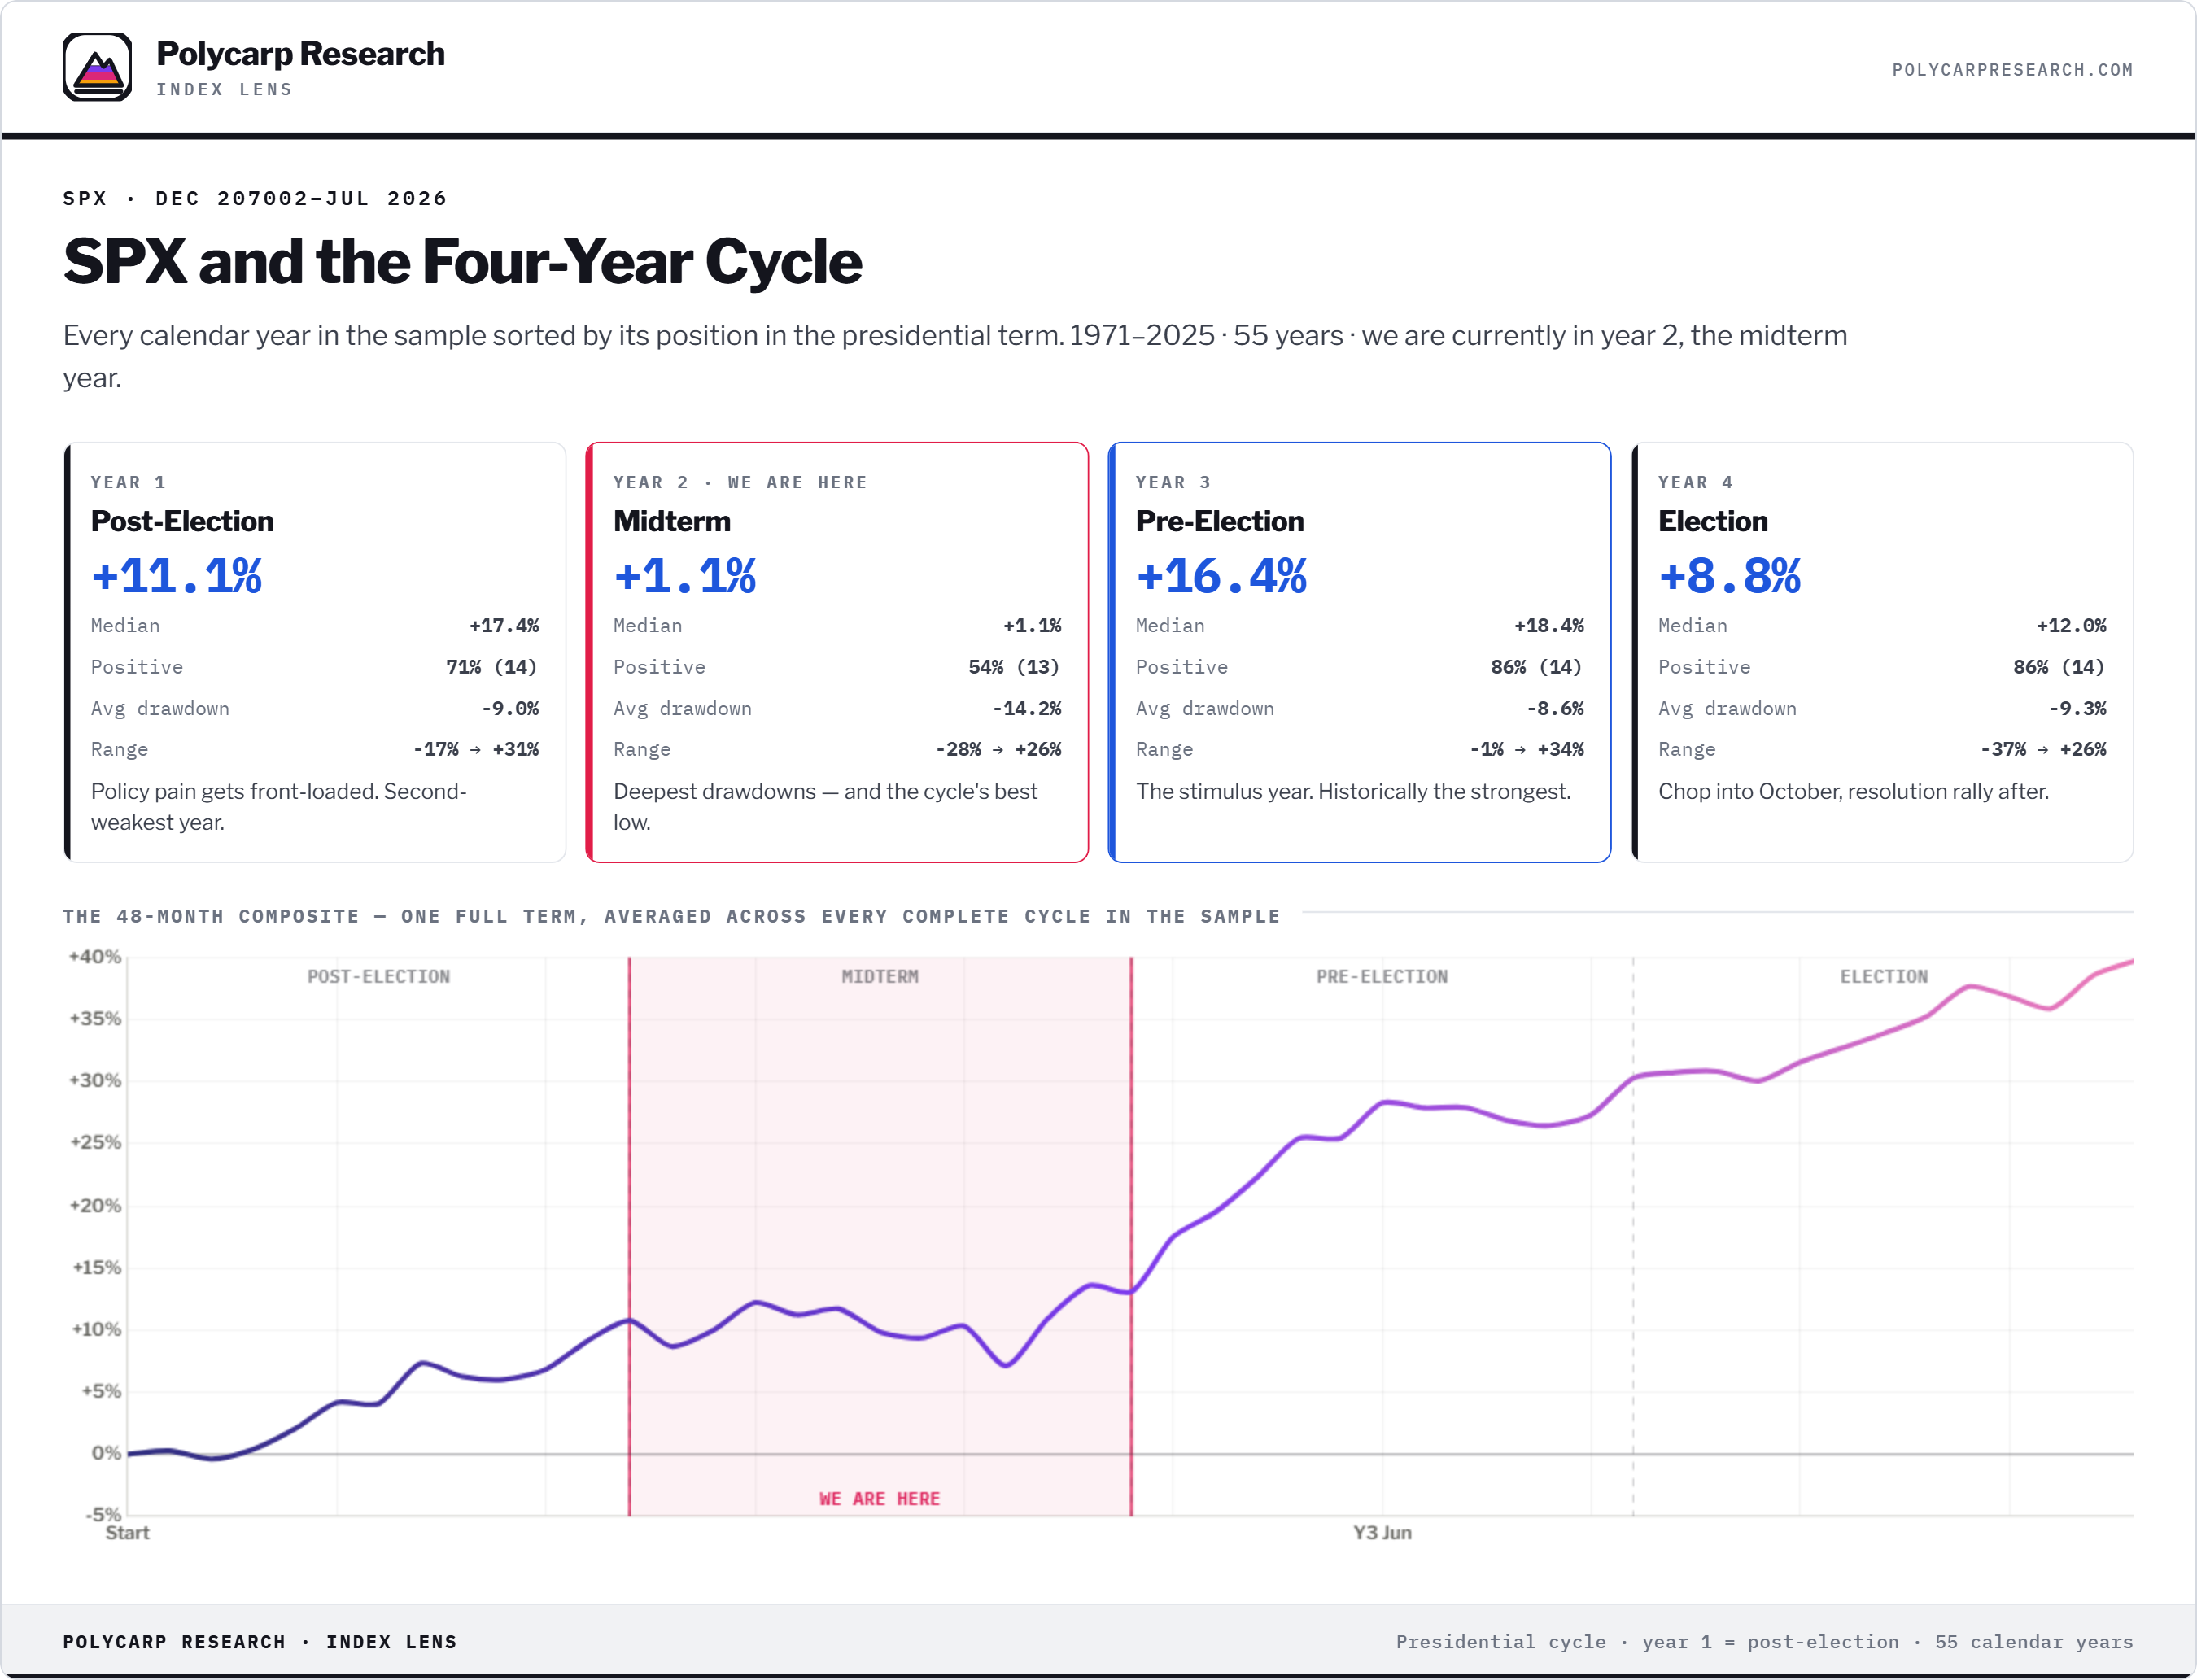
The Midterm Year is the year of historically lower returns, we are a few months away from entering the Pre-Election year, averaging over 16% returns. And the real edge? An 11-month election-cycle window opens at the Sep 30 close: 24/4 since 1914, 85% win rate, averaging 19.0%
Key Themes
Bonds
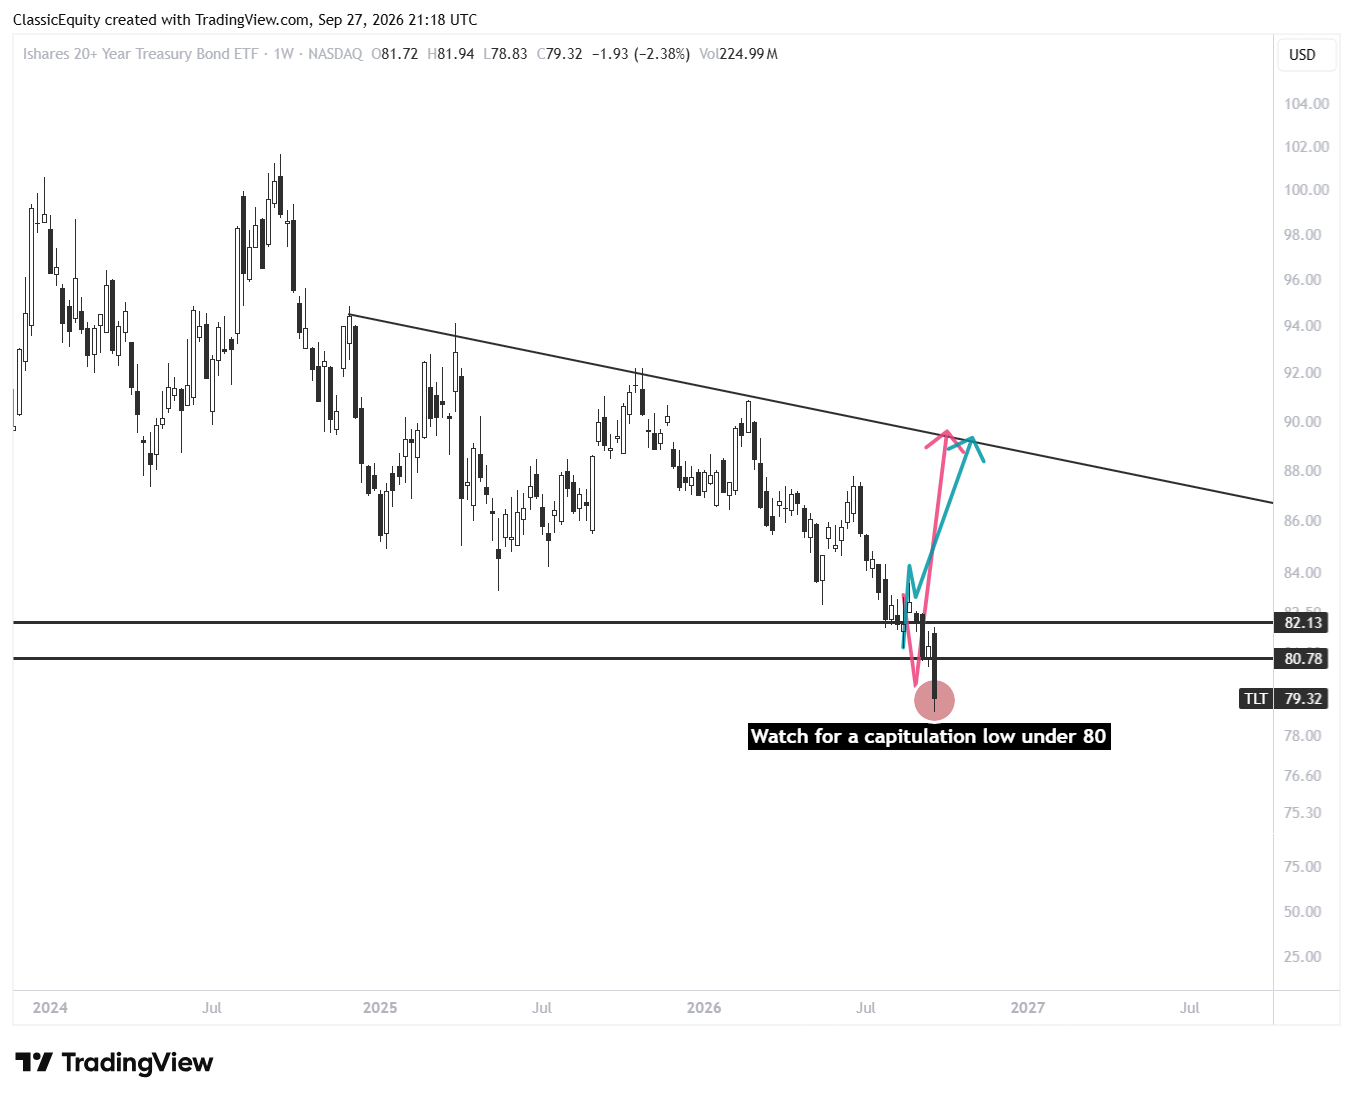
Did we just see the capitulation low I drew out under 80? Time will tell but if the 10Y tops out watch for the reaction from Metals and Small Caps.
Energy
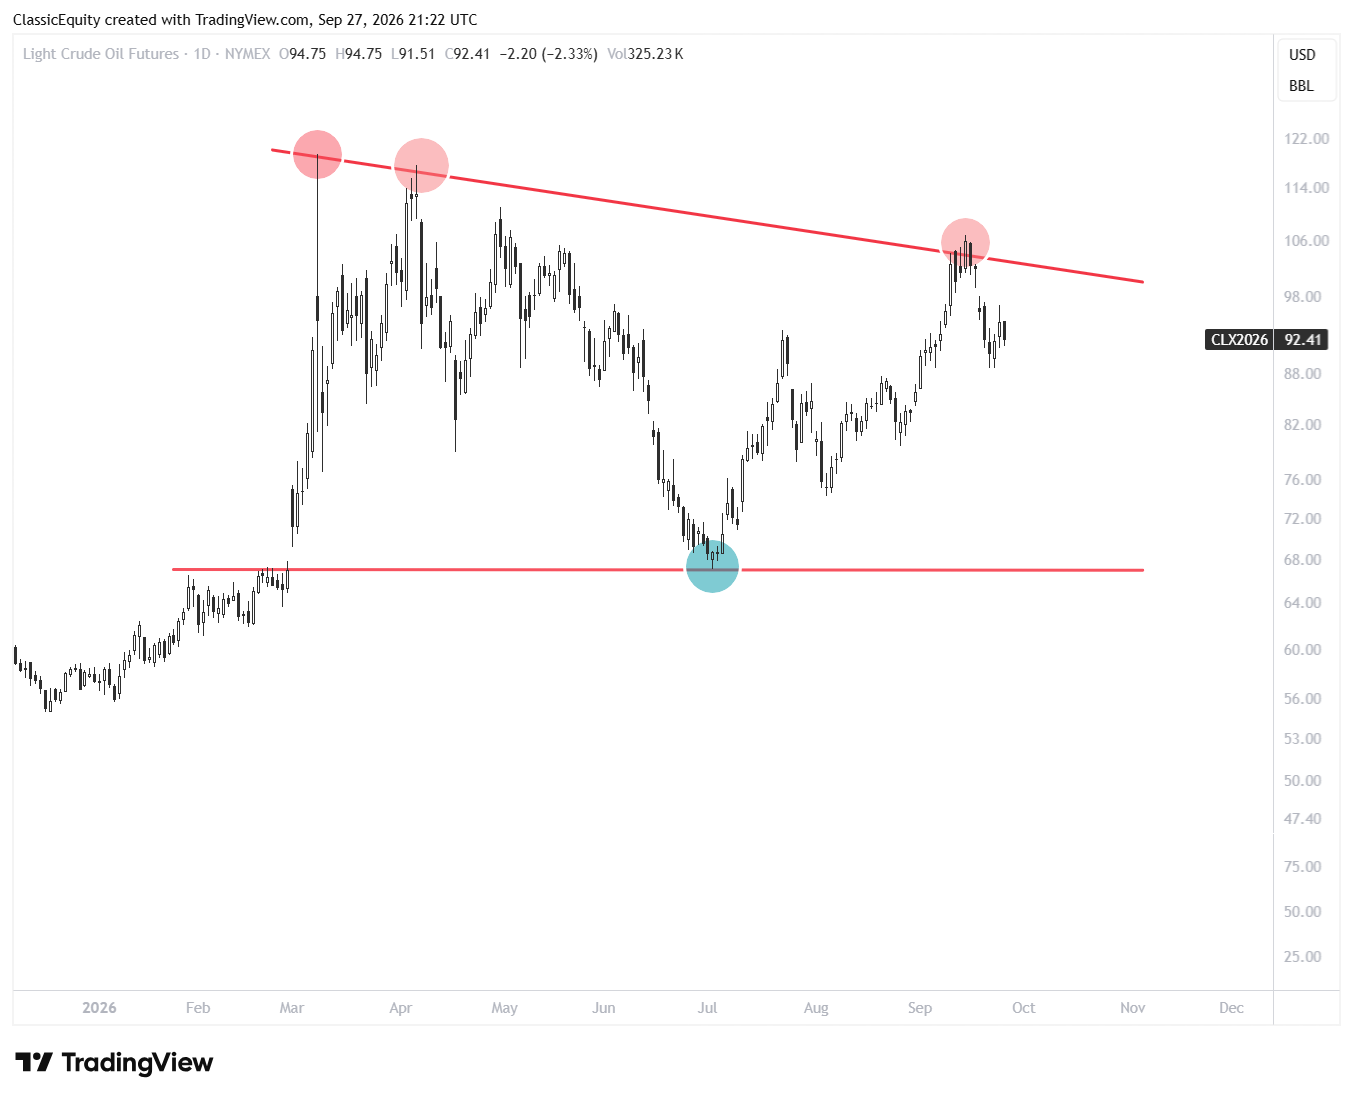
Crude level laid out has so far shown to be a nice topping point, not a bad call huh?
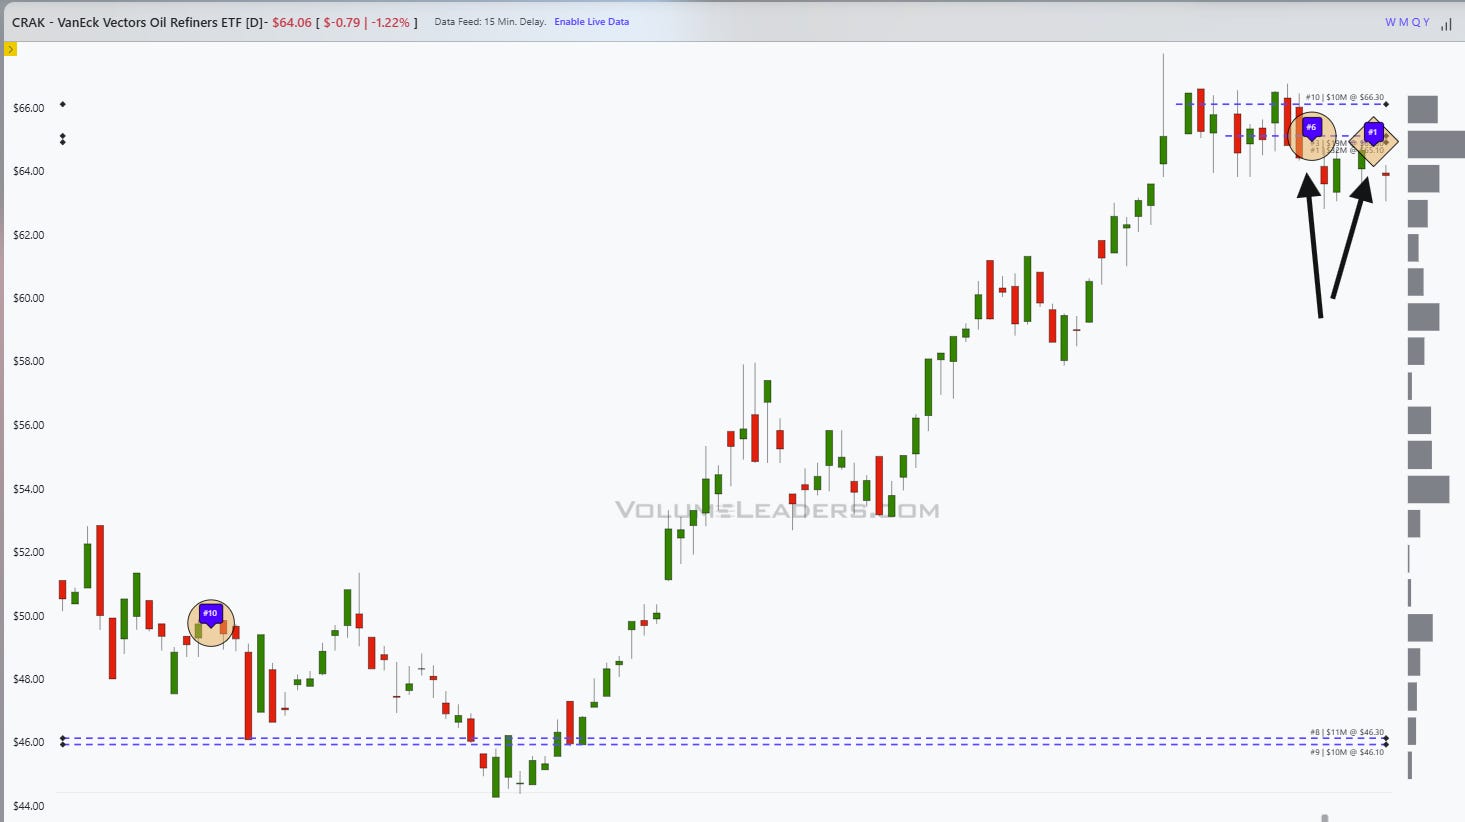
We also got two massive prints in the oil refineries ETF, I think we are close to this whole thing rolling over, this adds to the thesis on yields topping short term. However, a break and hold above these levels would not be a good signal for the overall market.
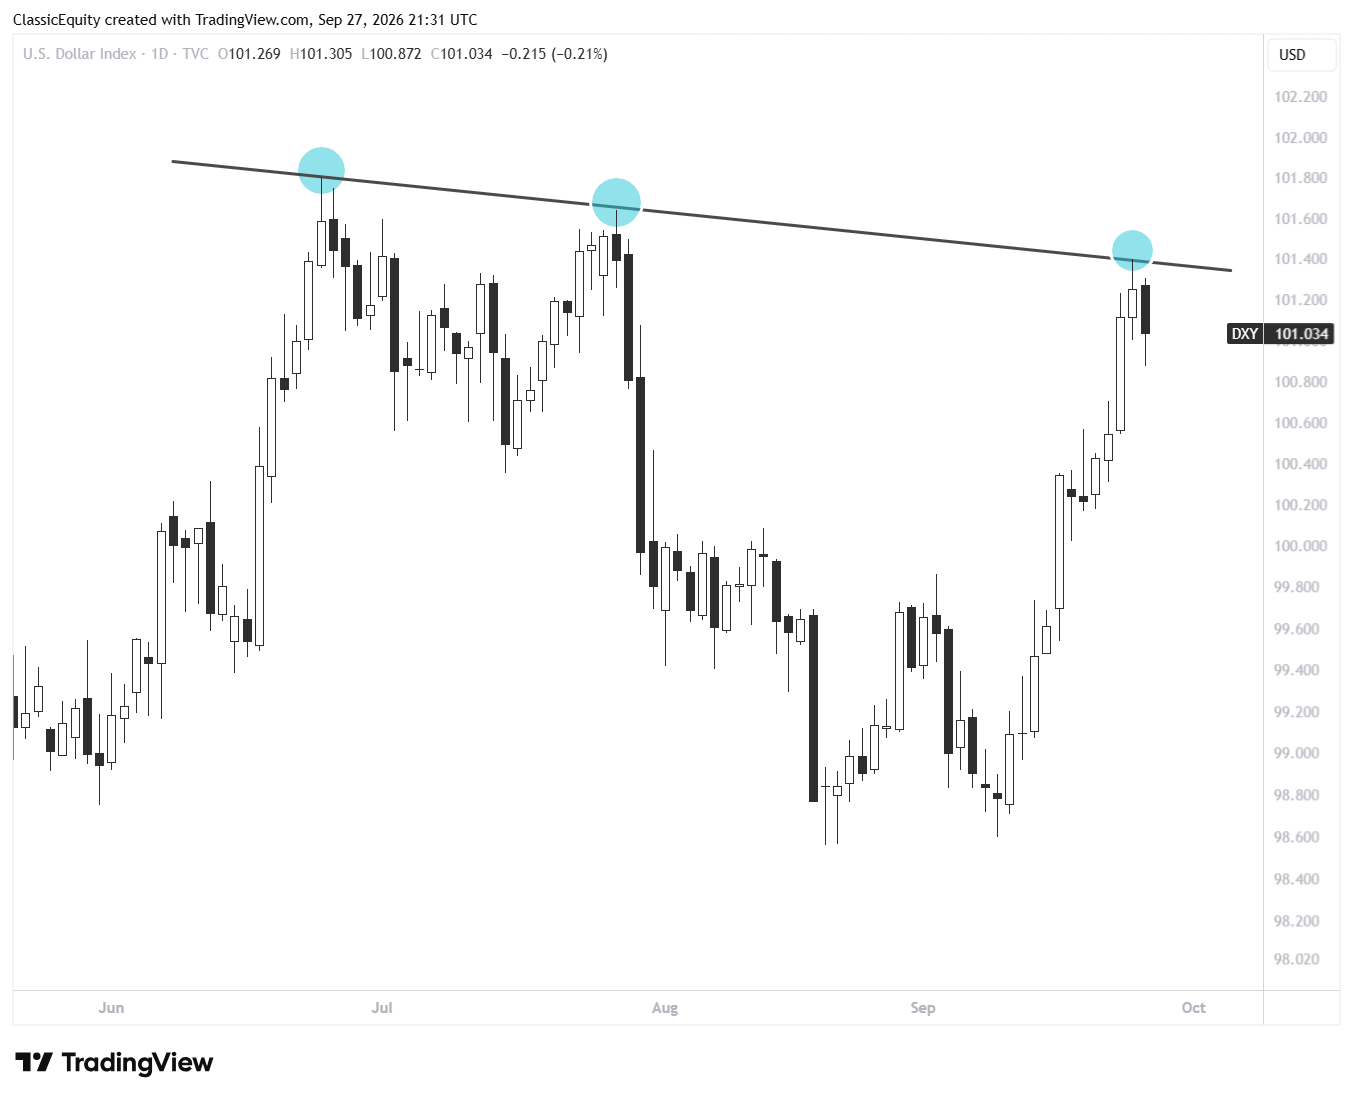
The Dollar
Keep an eye on this trendline, if the dollar rolls over the end the year expect precious metals and the overall market to do quite well
Bitcoin
Bitcoin breaking above 80k surely isn’t a risk off signal for the market and should be a good sign for whole crypto sector if it keeps up, now entering its strongest month of the year historically.
Earnings This Week
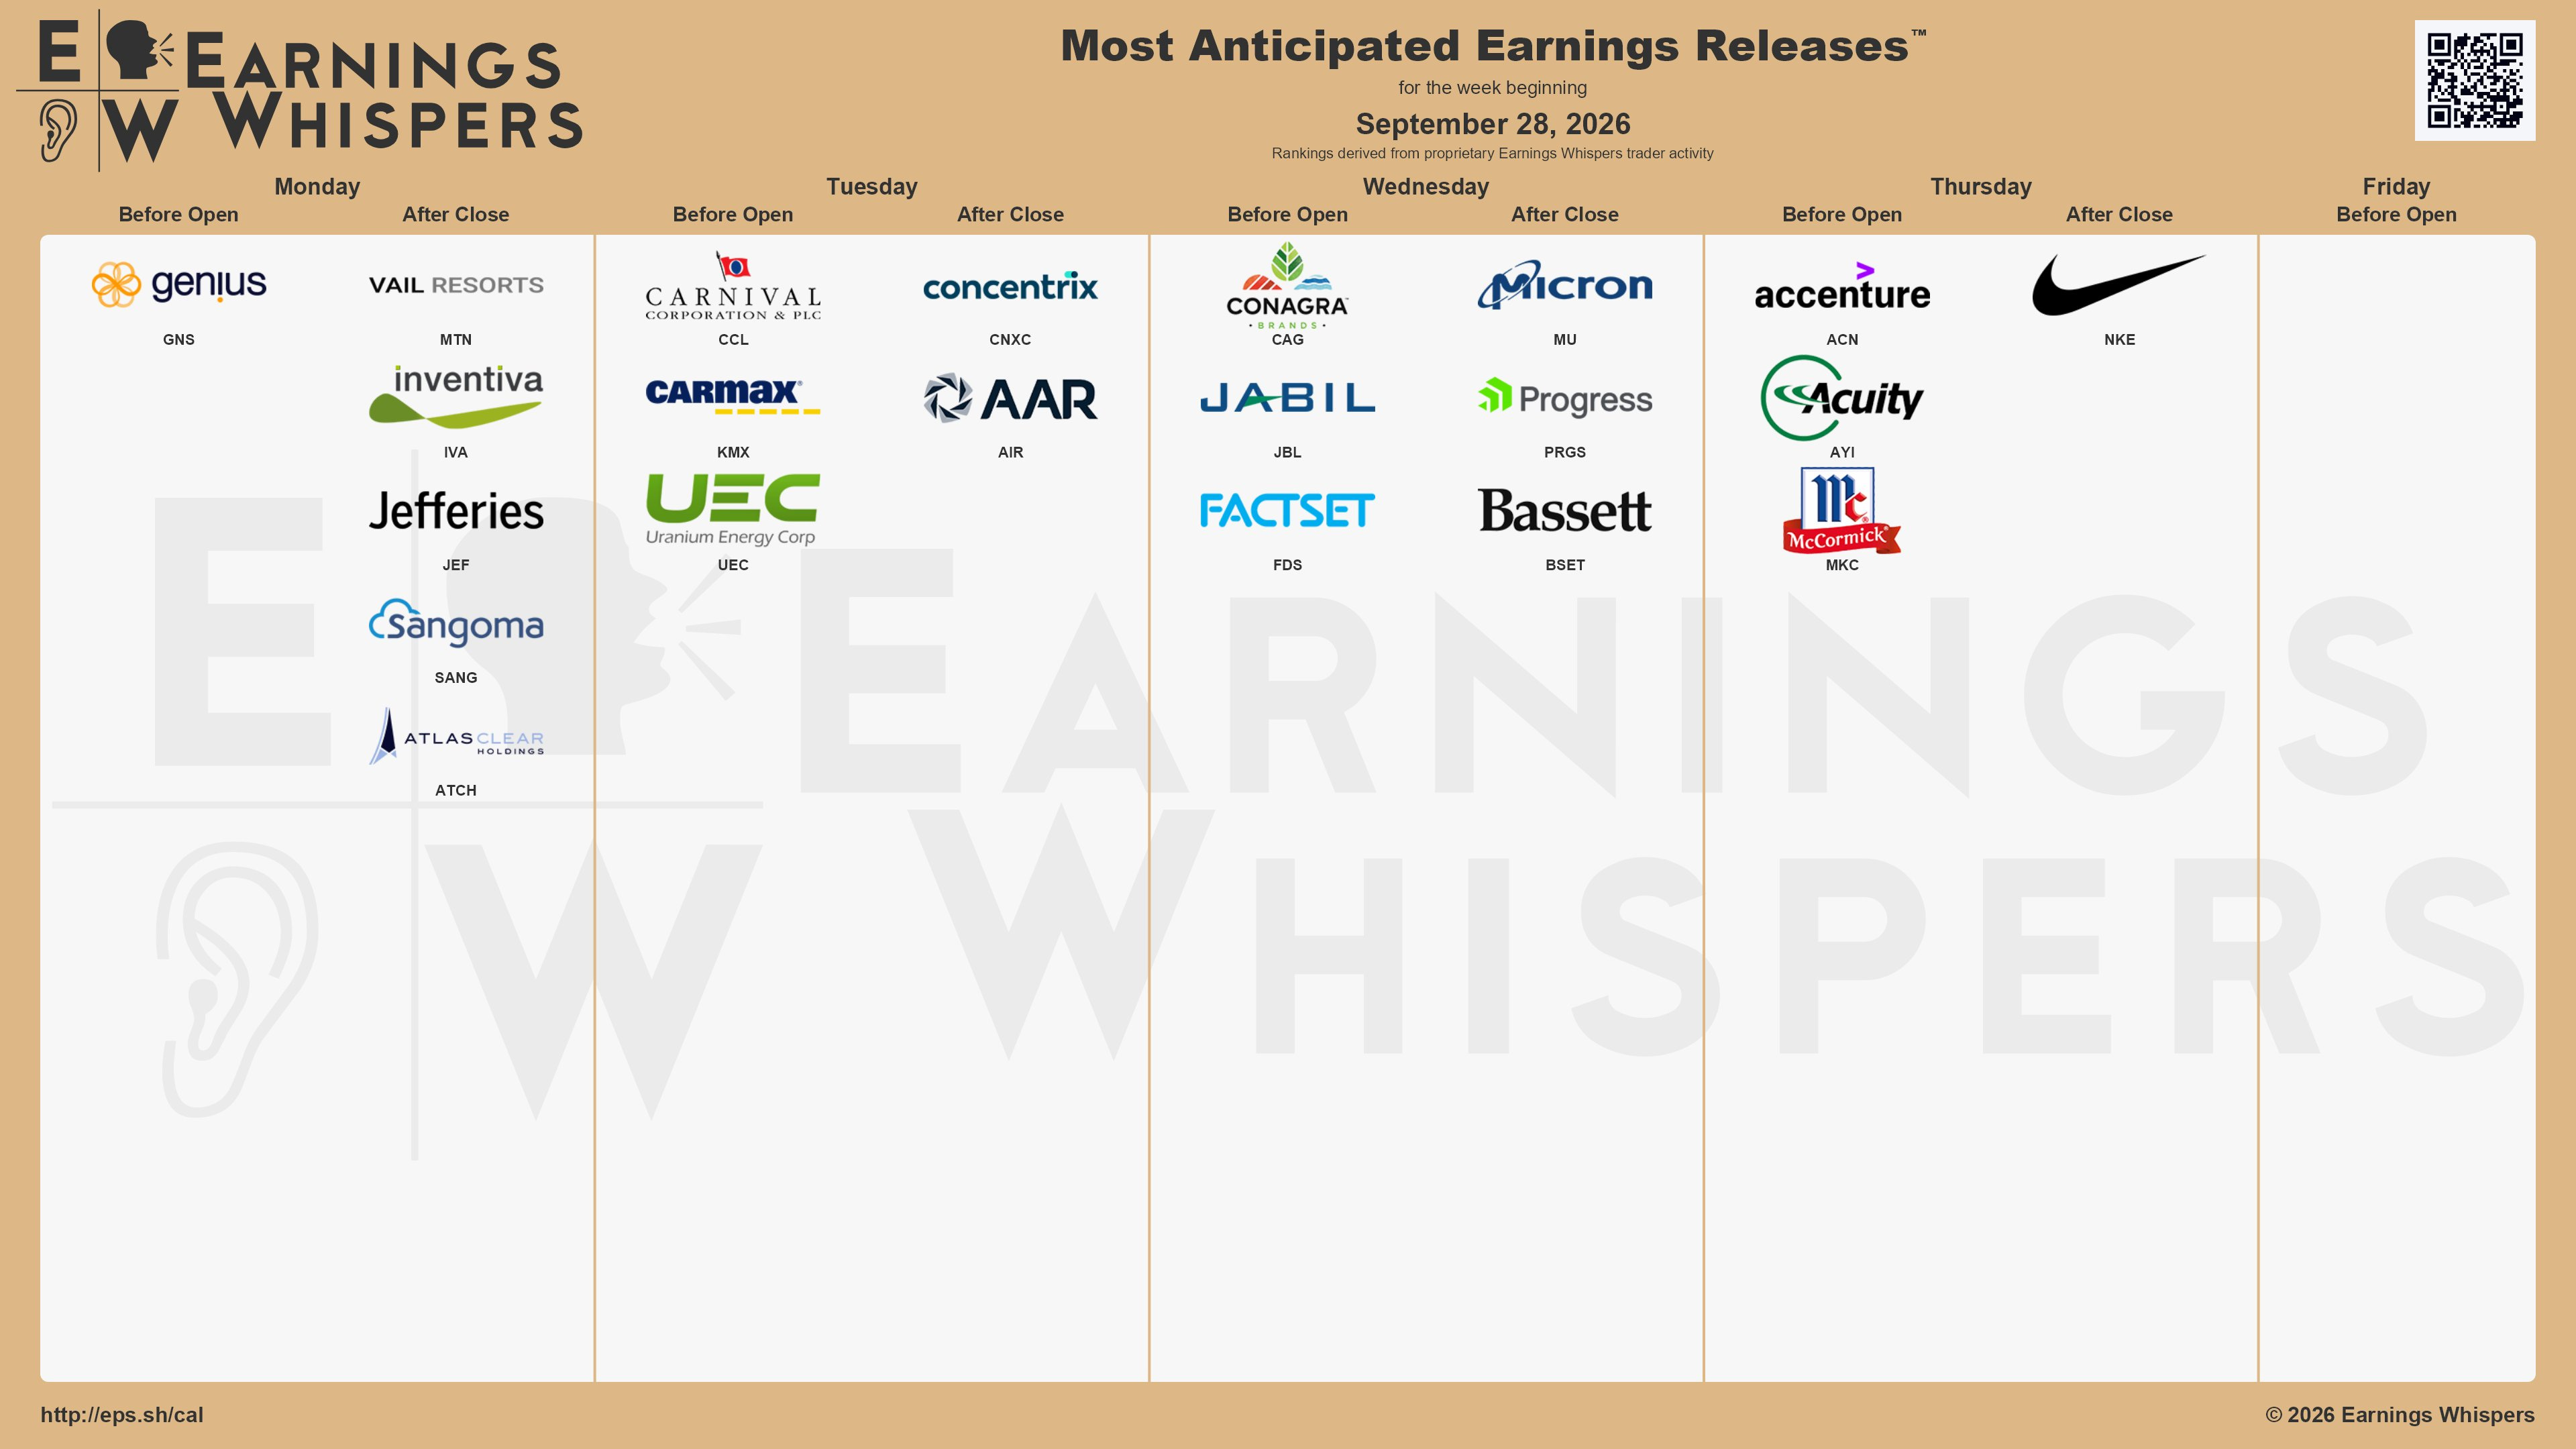
As mentioned, Micron will be key on Wednesday and i’ll be watching NKE on Thursday to see if an opportunity arises.
MU
NKE
Positioning & Flow
Buyback data supports the idea that we could see weakness into the 1st half of October but only one data point.
Final Thoughts
Do not lose sight of the key window upcoming, we are exiting the high volatility seasonal window of the Mid Term Year. Does that mean we won’t crash at some point by end of year? No. What it does mean is that the historical averages start to be more on your side from a seasonal standpoint. Cheers!