



The market had consolidation last week after it hit some initial upside targets and soon might be the time to start scaling back risk before the typical late-Q3 seasonal volatility becomes more dominant. This is especially true in Mid Term Years where historically the best buying window of the cycle is only a few weeks away.
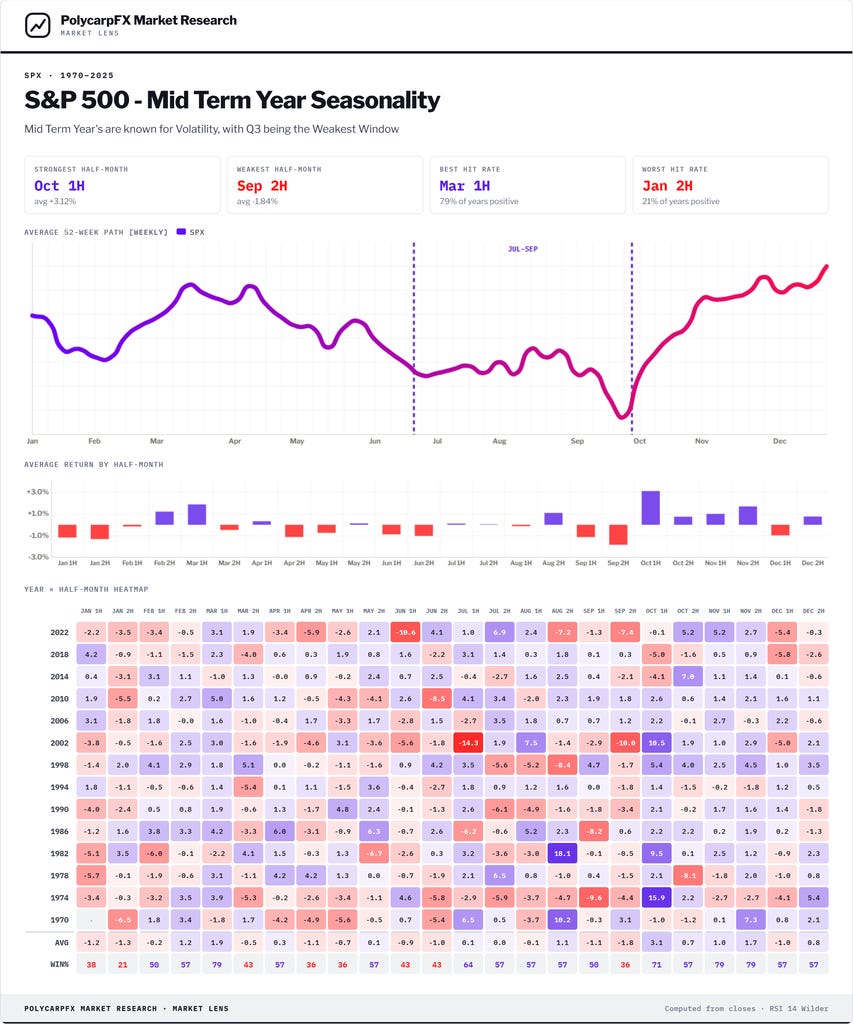
One of my favorite investors, Dan Niles recently shared similar thoughts “With more than 80% of the unwind finished in ~3 weeks, it would imply this should be mostly over by next week…At which point I can go back to worrying about 1) the median 10% drawdown typically seen on the S&P from peak to trough during 7/30 -11/9 in mid-term years since 1990 and 2) related to this, the US Treasury trying to bring down long-term yields and the bond market saying it will not work with yields across the curve now roughly flat to 6 bps above the levels on Tuesday prior to these actions.”
But, with that being said, doesn’t mean I don’t see some nice short term setups here to the long side. Let’s dive in.
Events This Week:
Bessent to speak on Iran - Monday
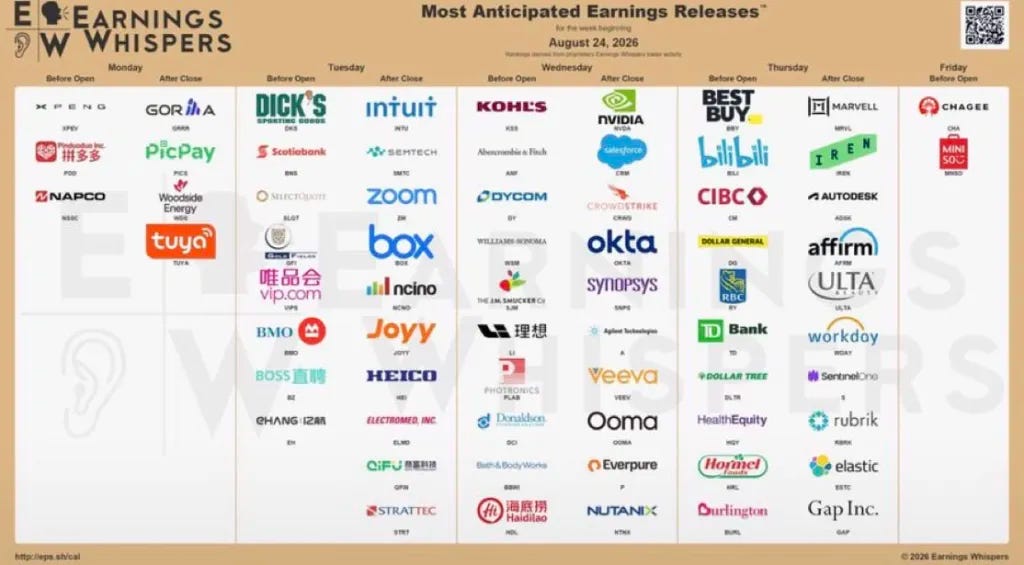
Wednesday has PCE Inflation data and NVDA Earnings
Warsh to speak at Jackson Hole on Friday at 10AM
Key Earnings This Week
Tuesday - INTU, ZM
Wednesday - NVDA, CRM, CRWD
Thursday - S, IREN, MRVL, AFRM
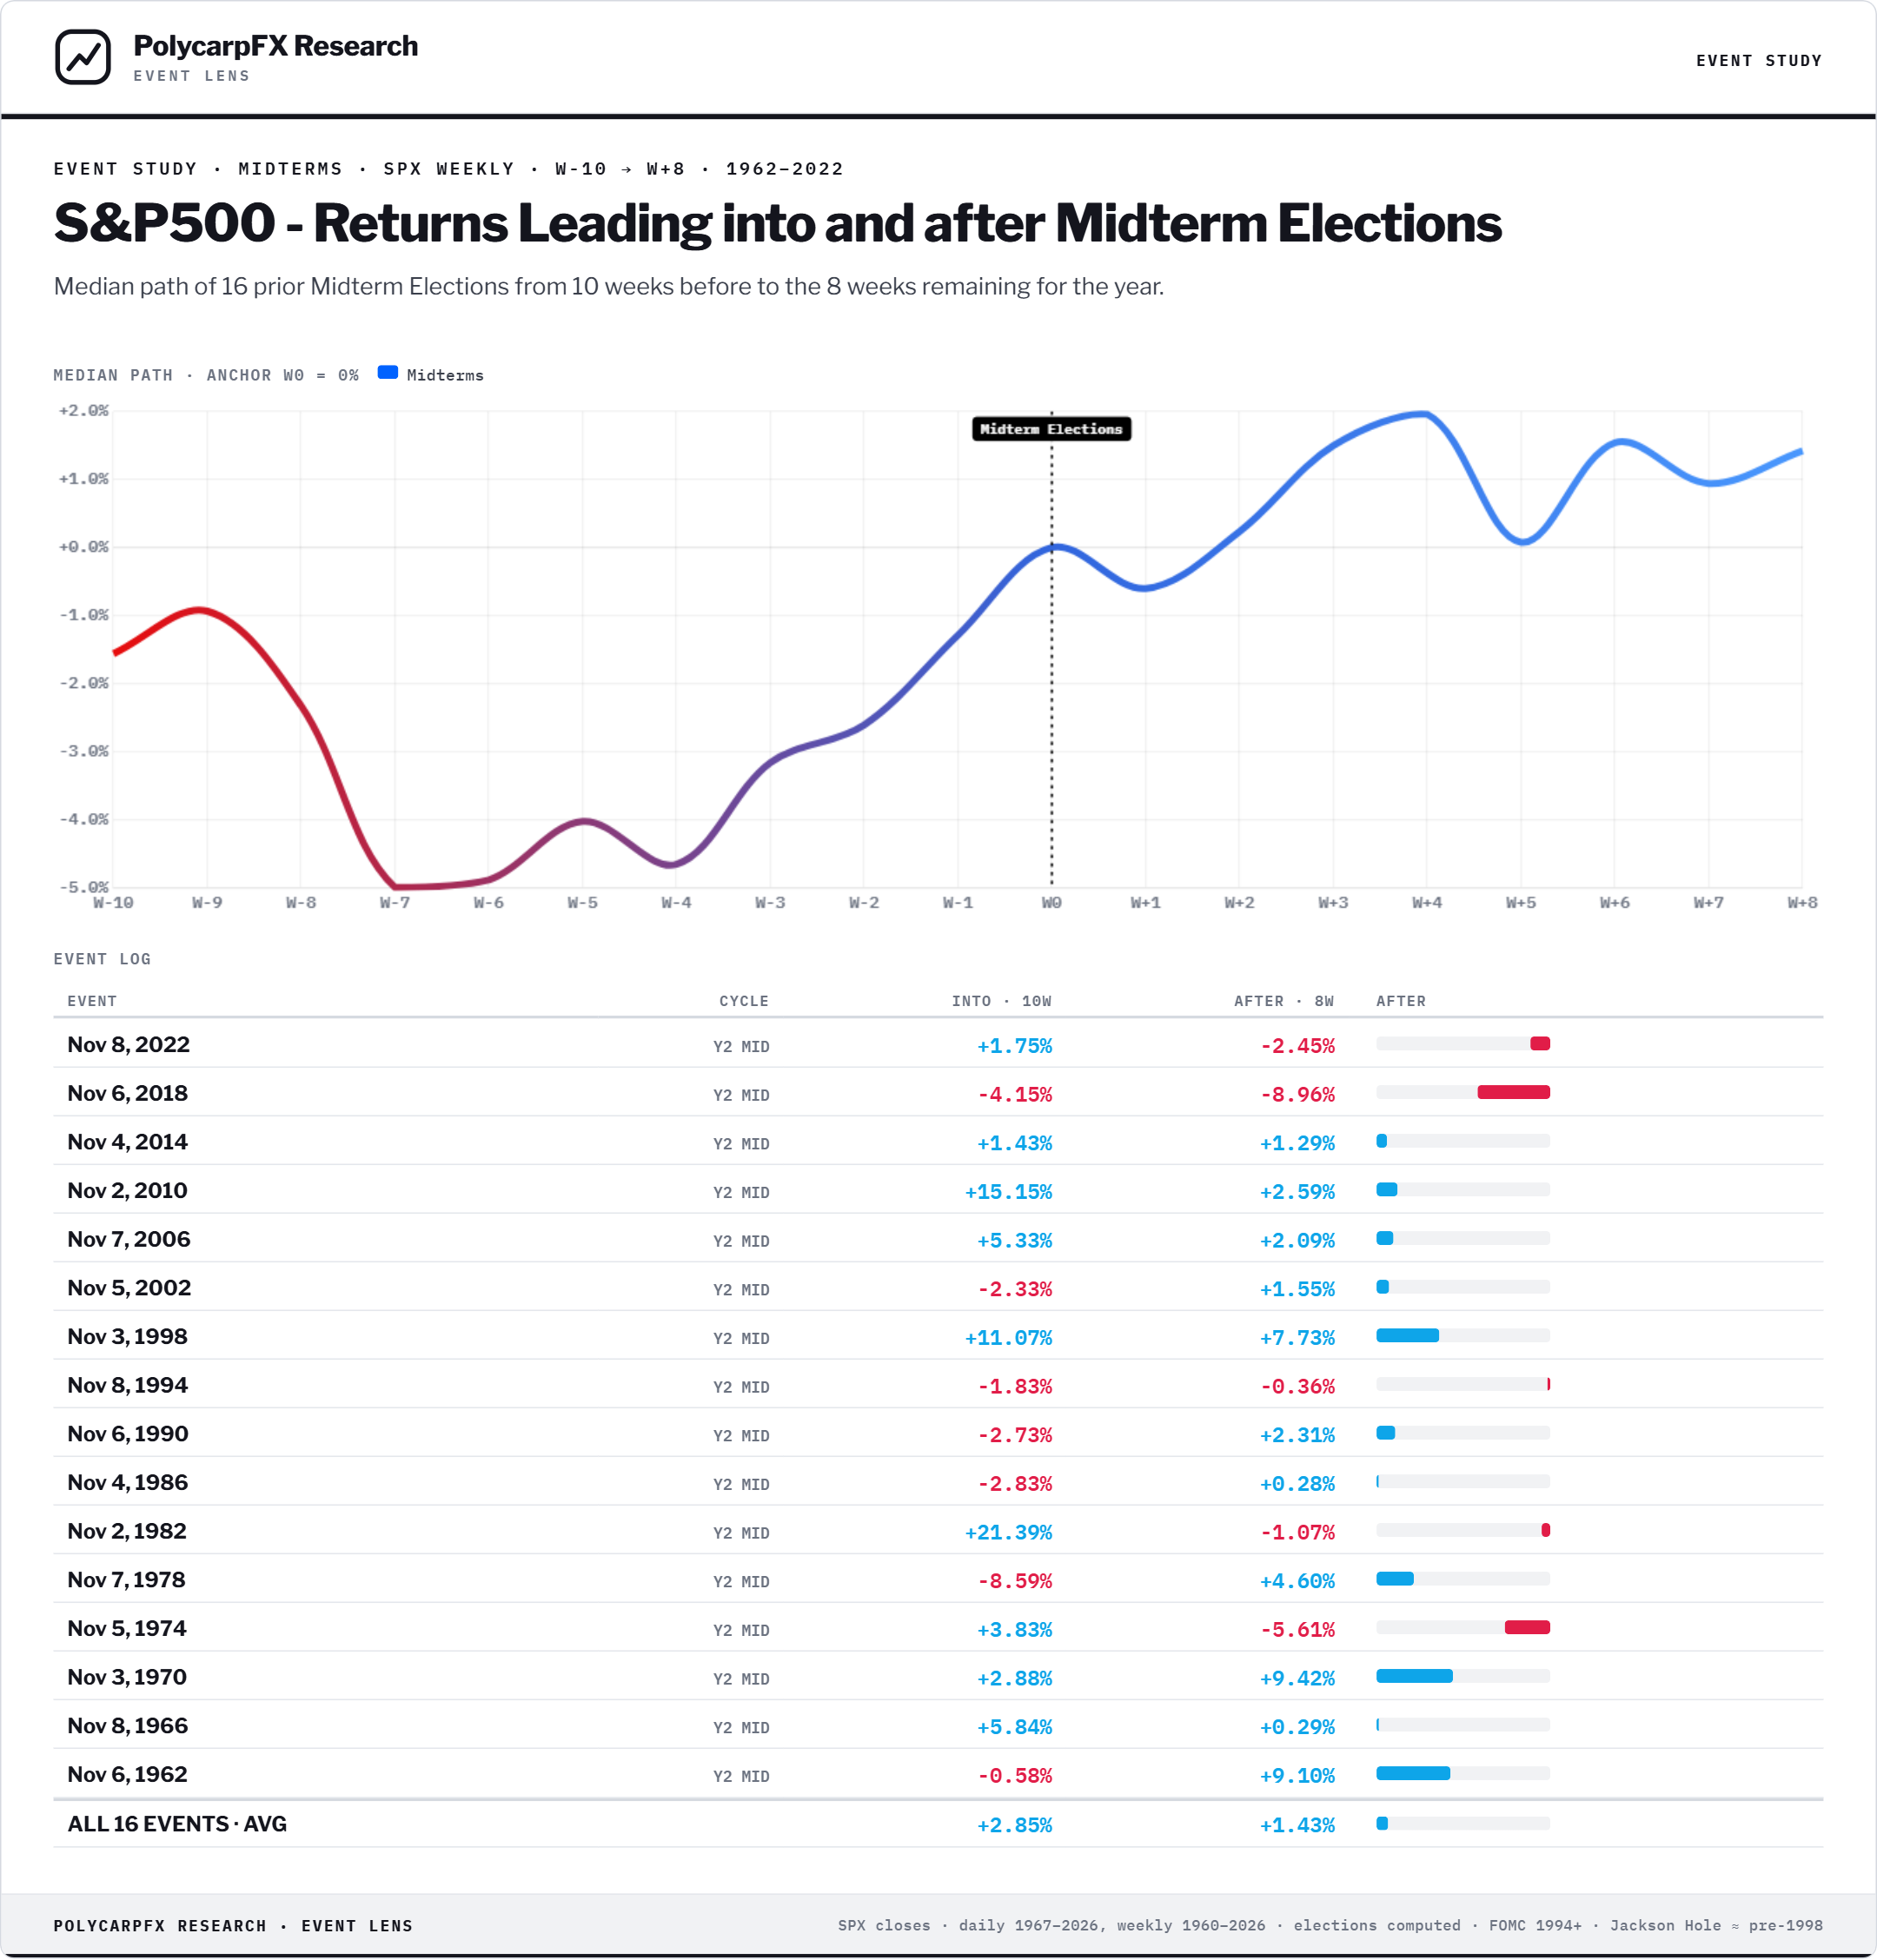
Where are We?
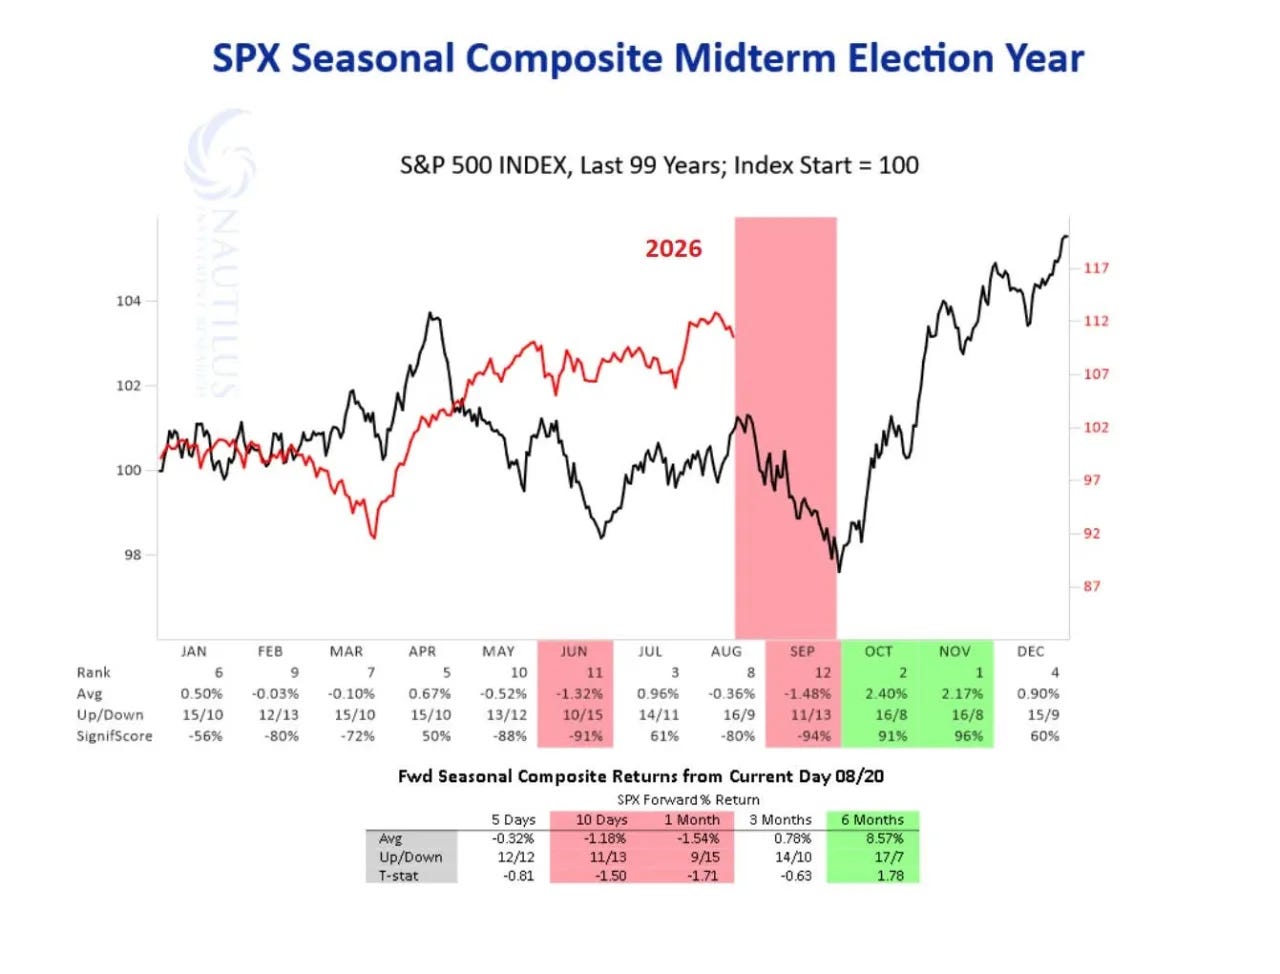
We are 10 weeks away from Midterm Elections. The average path below shows how much risk often shows up in September and October.
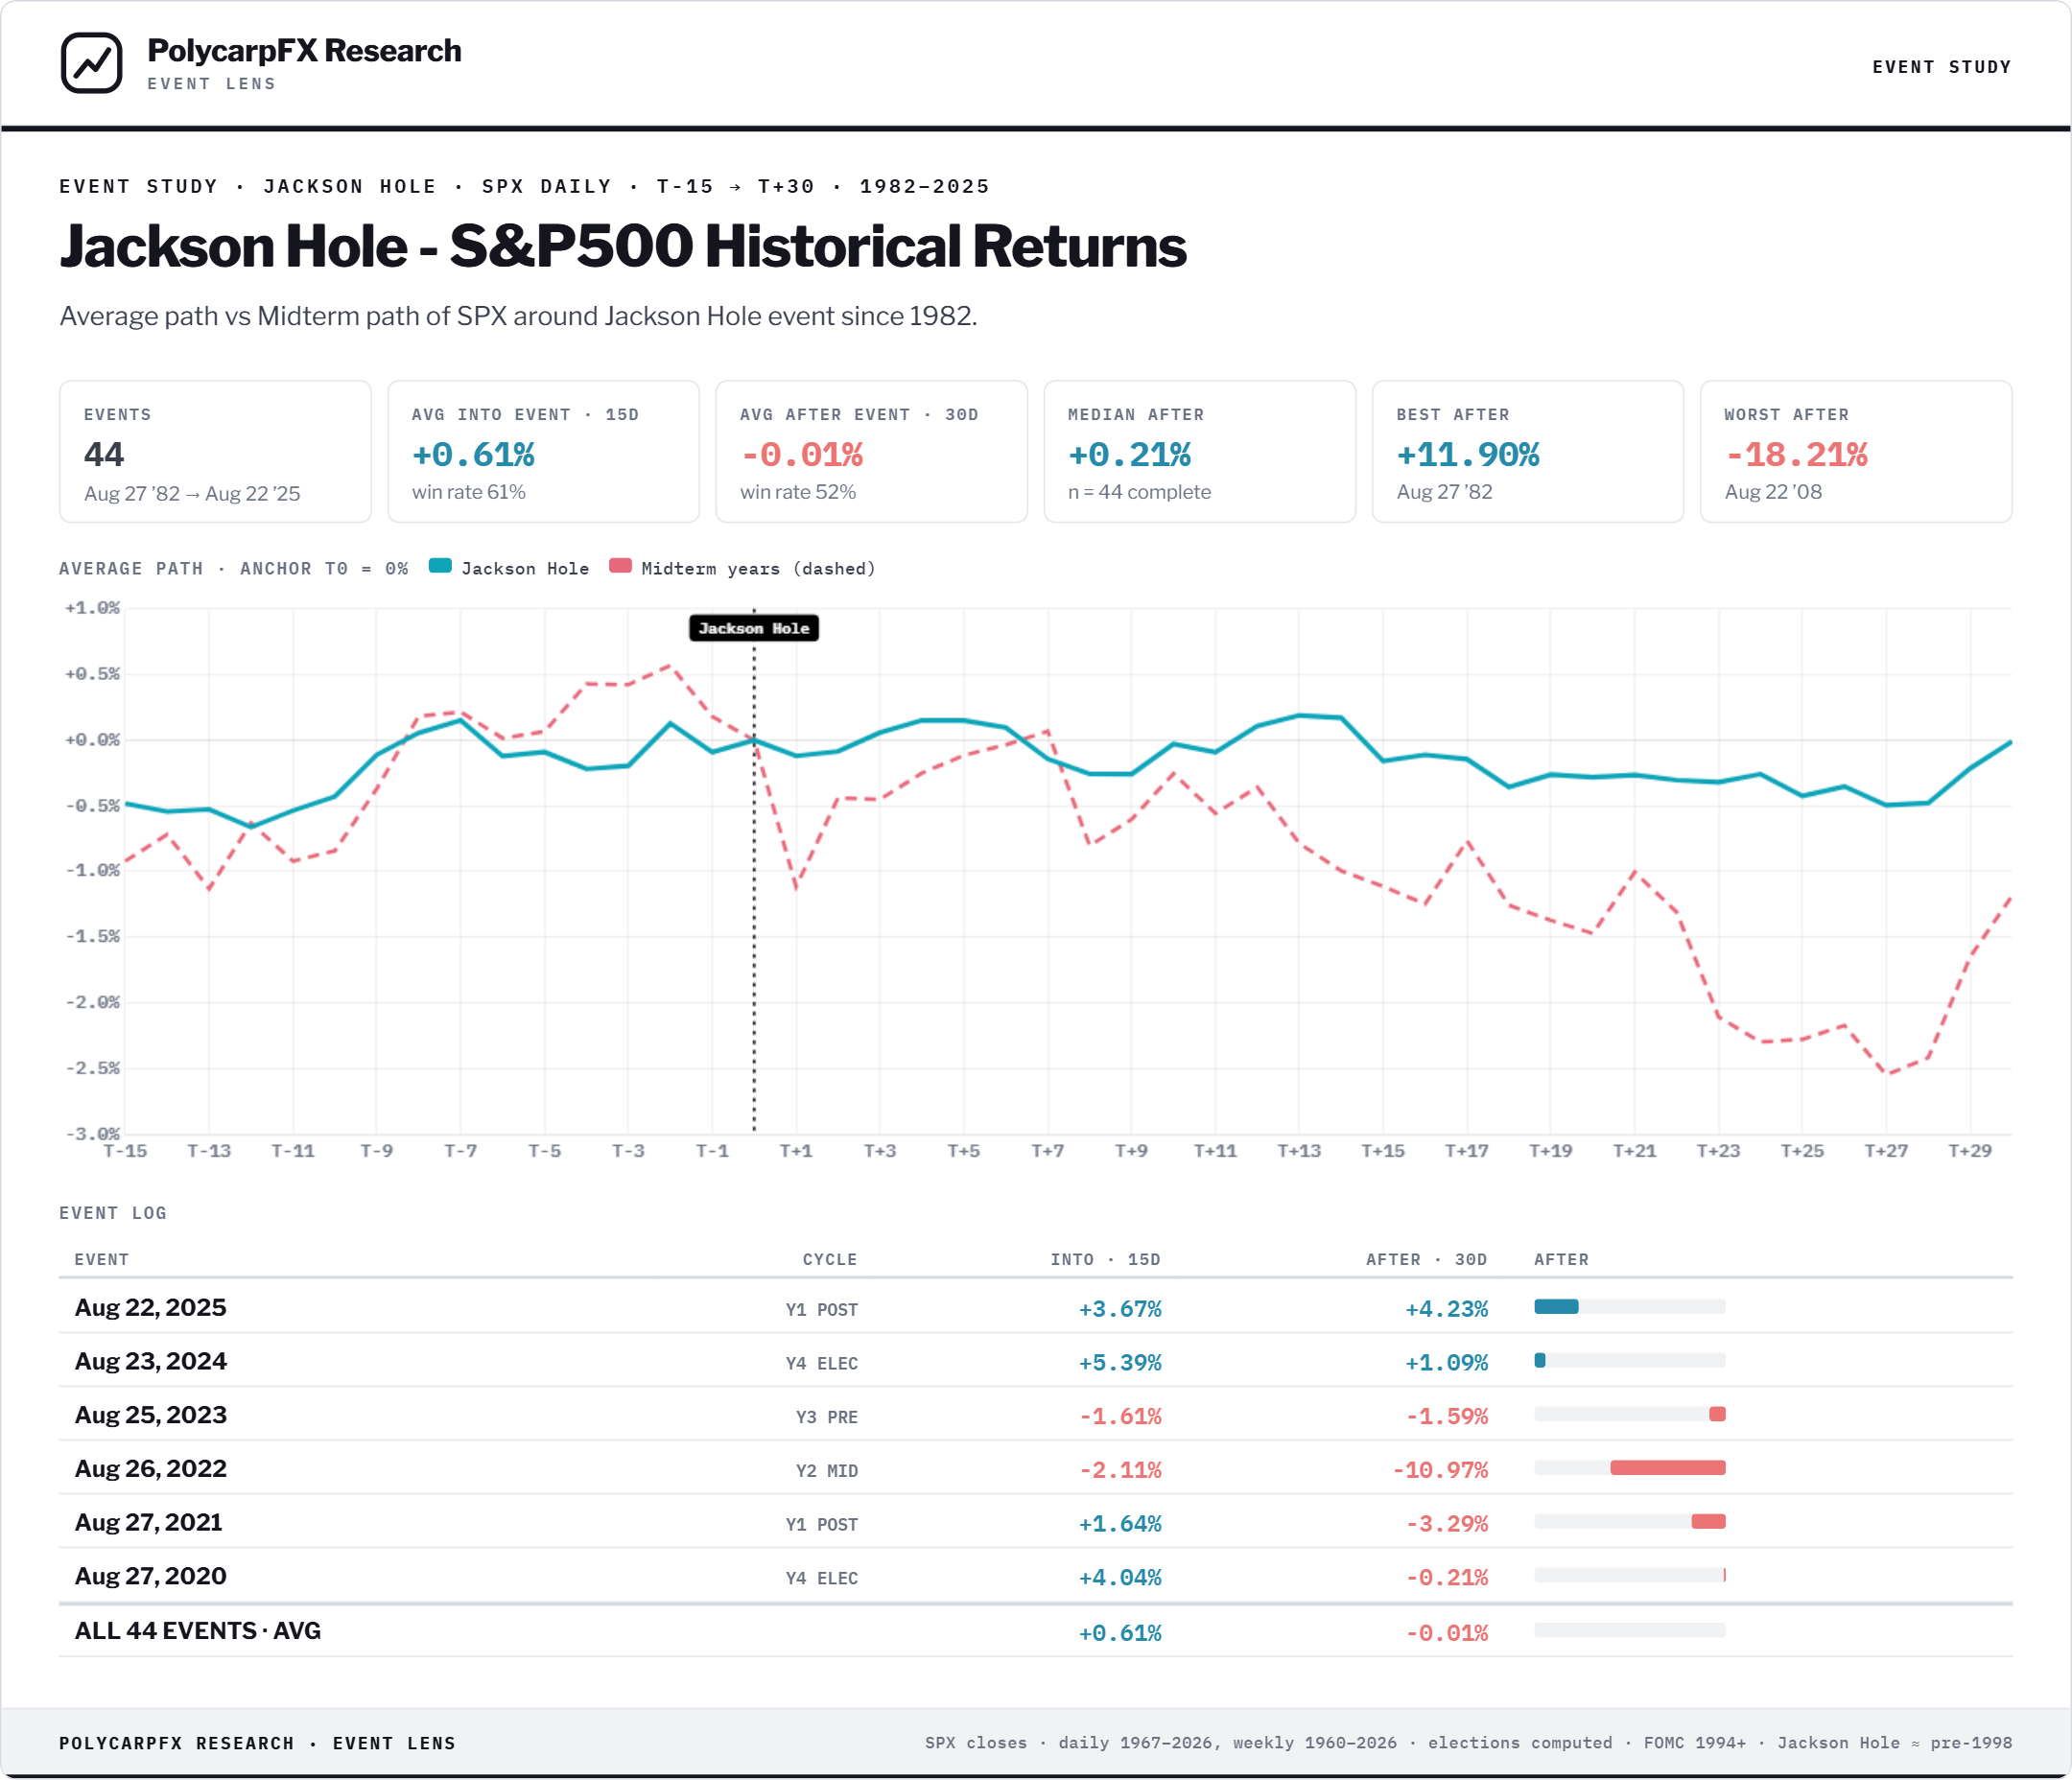
Jackson Hole (Warsh Era)
Notice the path below and how similar it is to recent price action. The left side shows 15 trading days prior to Jackson Hole and the right side shows the 30 days after. The data at the top shows the average return is negative over that time frame but notice the red path, that is the return during Mid Term Years. (Maybe a hedge isn’t the worse idea)
One last point on this, the chart below from Nautilus compares our current year to historical Mid Term Years. I point all this out not to imply loading puts is the play, just making sure the risk associated with this upcoming window is considered.
Nvidia Earnings
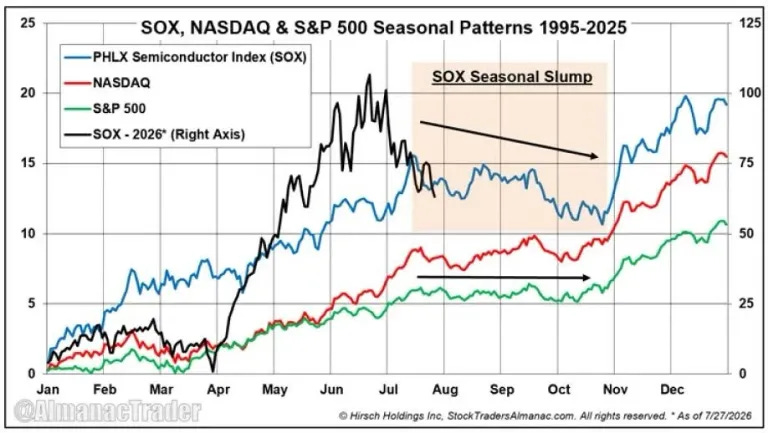
I’ll have a deeper dive on this Tuesday but notice the seasonal pattern for the semi sector shows the recent weakness, rally, and further decline. Keep this in mind, especially if SMH / SOXX / NVDA fill some of those upside gaps this week
Final Thoughts
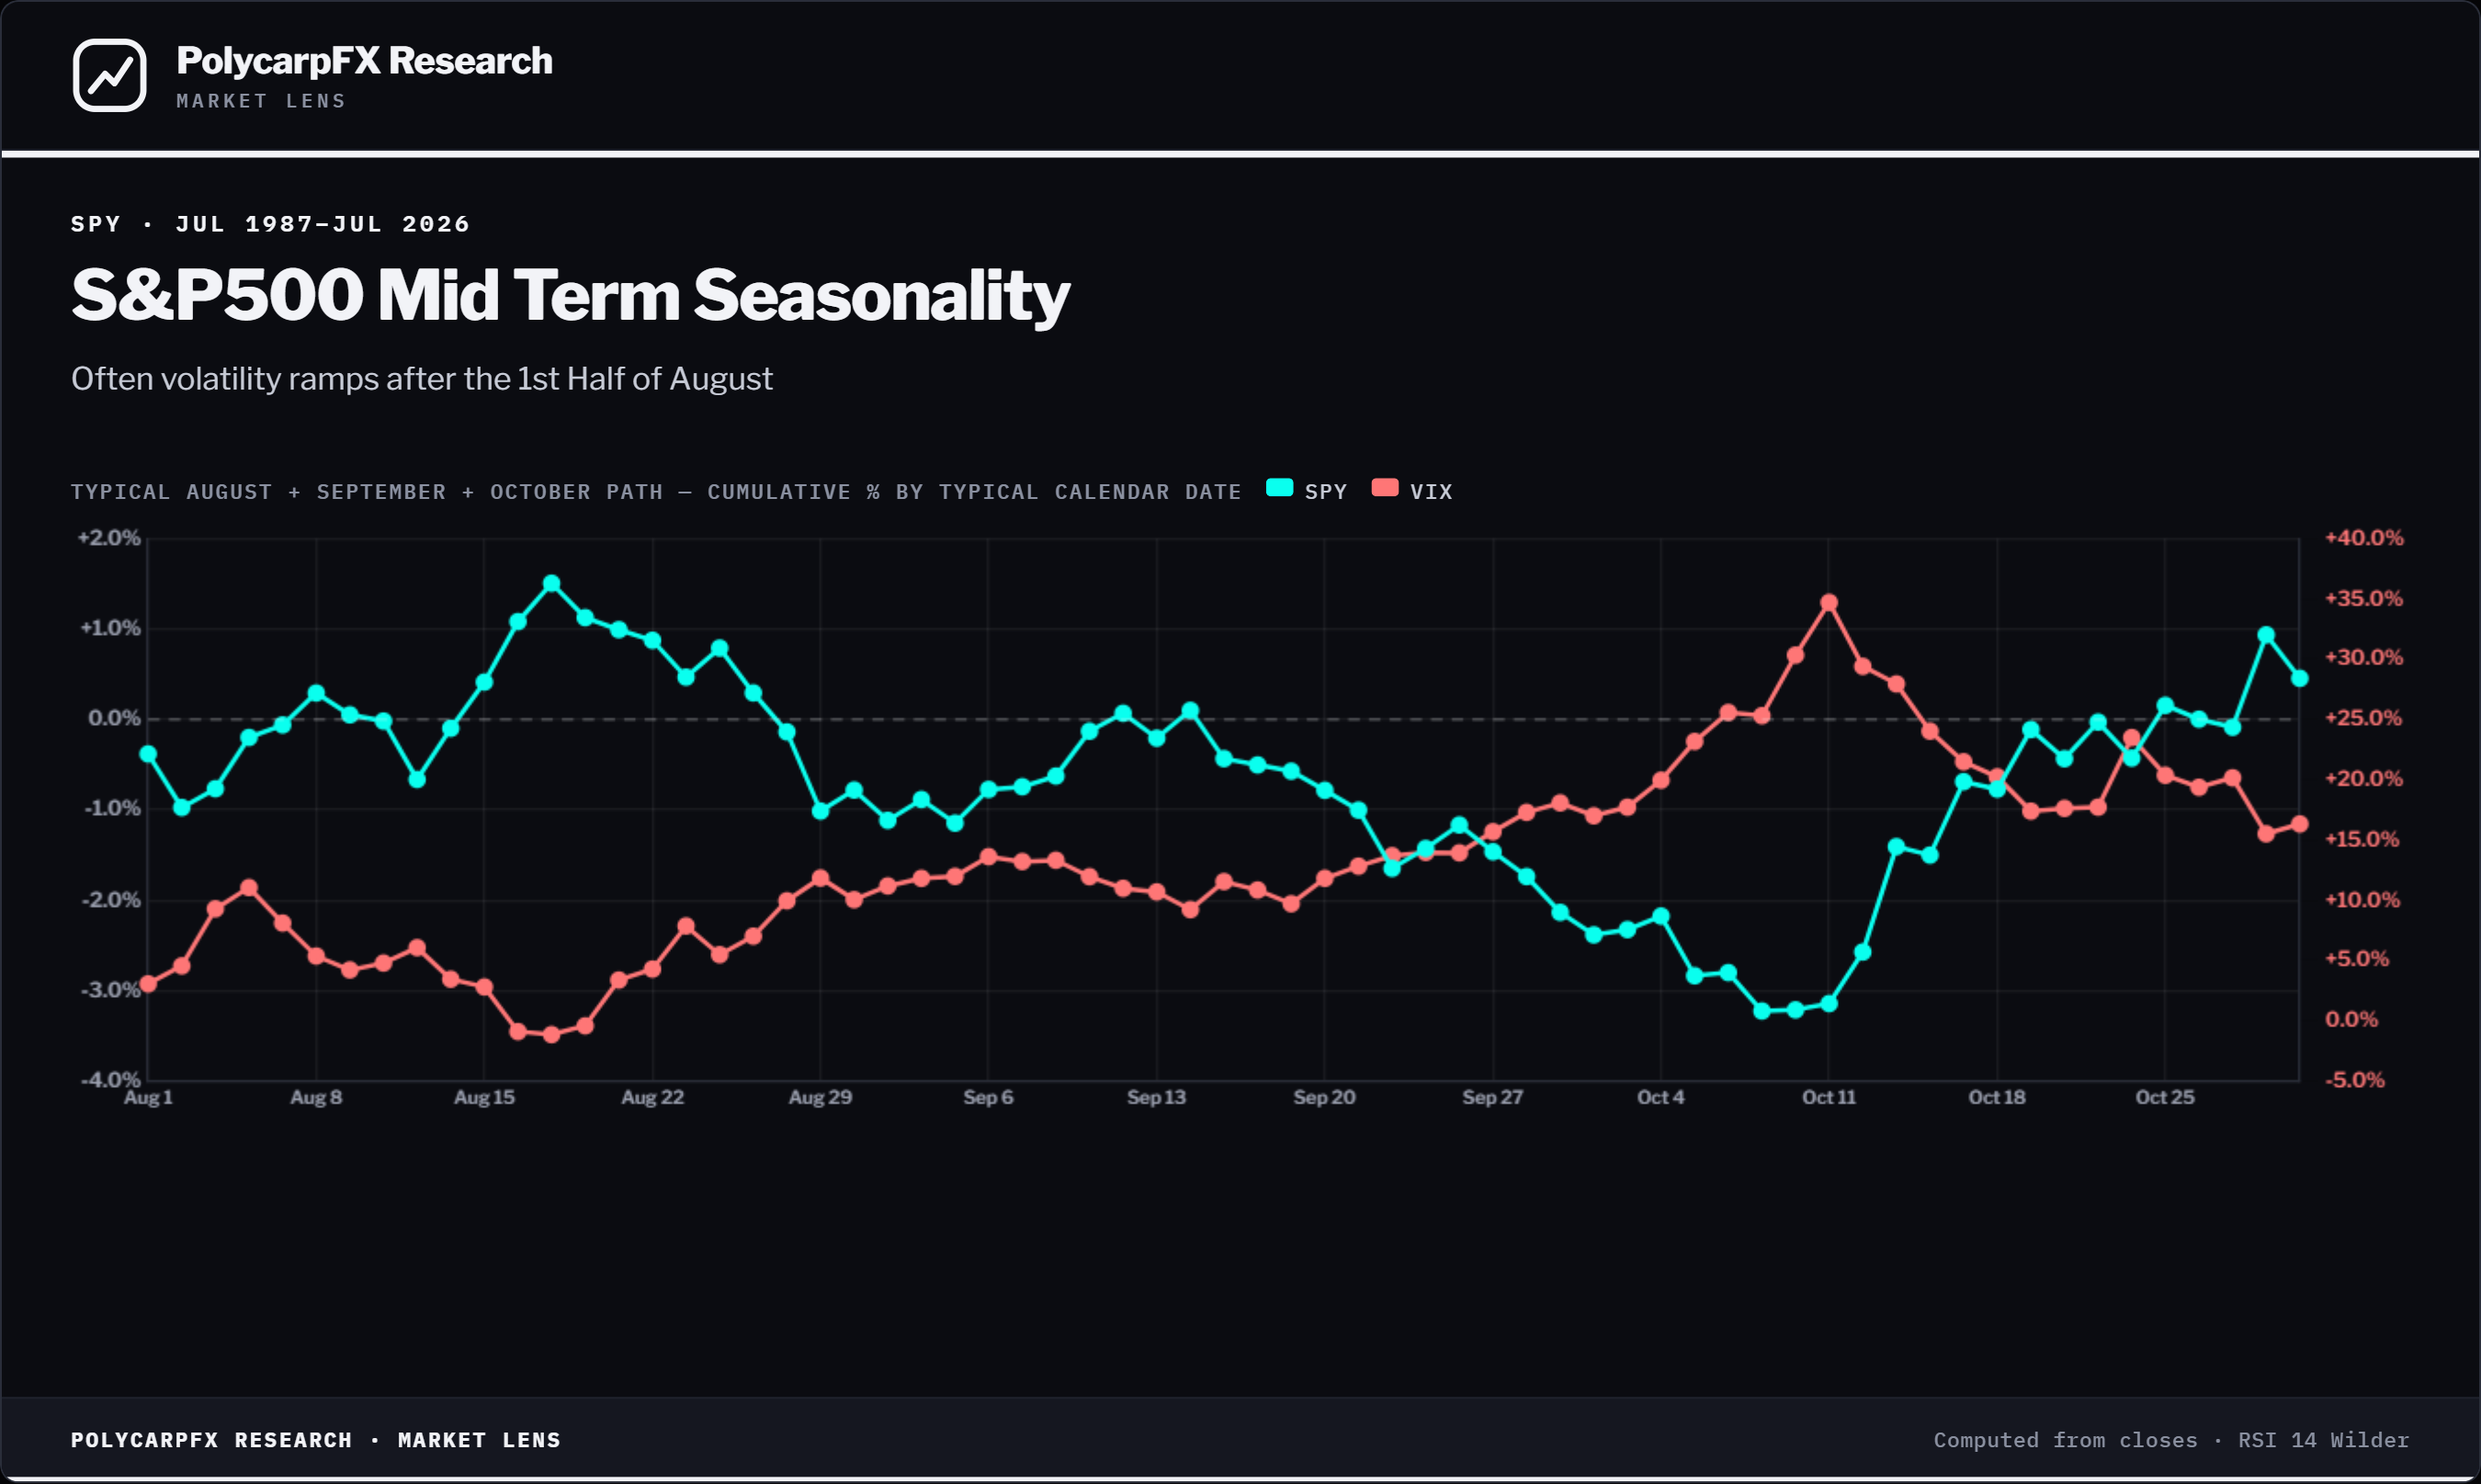
I’ll be releasing my trade idea’s tomorrow for premium members but I’ll leave you with this. I shared this seasonal chart recently and it has closely followed with recent market movements. I know I shared some risk in the markets earlier but that 1st half of September has been known to lure in some late bulls and also squeeze out aggressive bears before the fall. I think the key is be open minded when it comes to timing and calculate the risk around your trades and when the risk can really spike.
If you found this content valuable, consider becoming a premium subscriber where I release new data each week and share my own trading and investing journey.
Primer: Bitcoin Seasonality and Cycle Guide

The data in this report is extensive and serves as a great tool each year to navigate Bitcoins seasonal trends and cycles. Be sure to make it to the end where I share the Almanac guide and provide a special discount for premium access.